Imaris Open
FILE EXCHANGE & FORUM
Frequently Asked Questions
 オックスフォード・インストゥルメンツー事業部ページ

Imaris 9.7 expands our existing structural and spatial analysis to allow quick measurements of the proximity of cells to a tissue of interest and whether their distances relative to that tissue display a non-random distribution. These new tools allow you to answer questions like, “are microglia found near plaques more often than expected by a random distribution?”. Also, Imaris can now report if a protein is accumulating preferentially in the peri-nuclear region of your cells.
This release also provides tools that expand Imaris’ timelapse analysis capabilities. Assessing the effects of events (e.g. cell divisions) in your timelapse images can be difficult if those events take place at different time points in your timelapse. Imaris 9.7 allows you to measure the dynamics associated with those events, whether they’re changes to cell motility, morphology, or protein expression. These new tools allow you to answer questions like, “what is the speed of chromosome movement in anaphase” and “does cell morphology change after addition of a drug”.
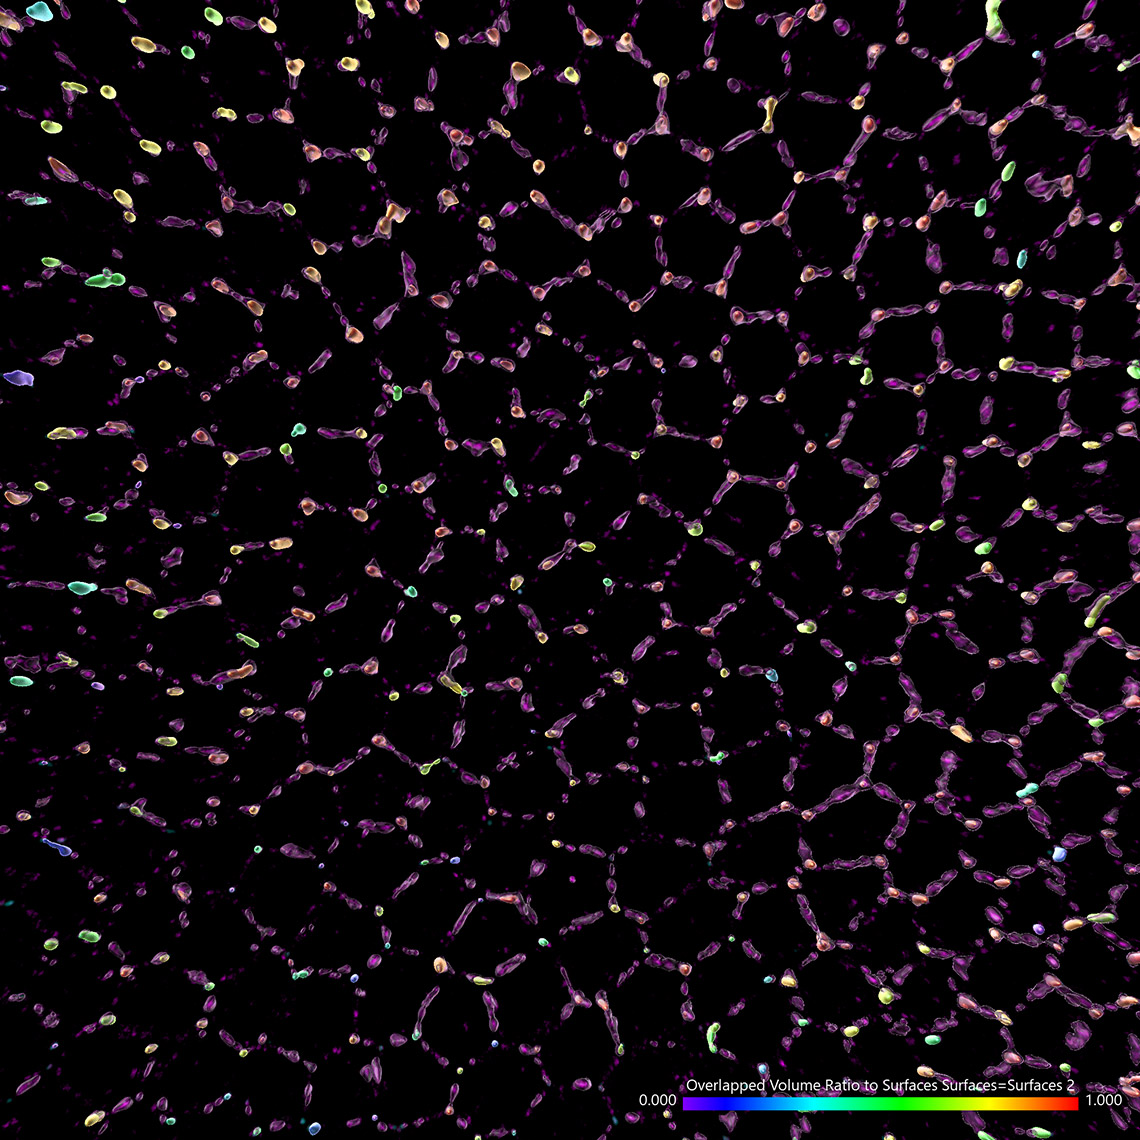
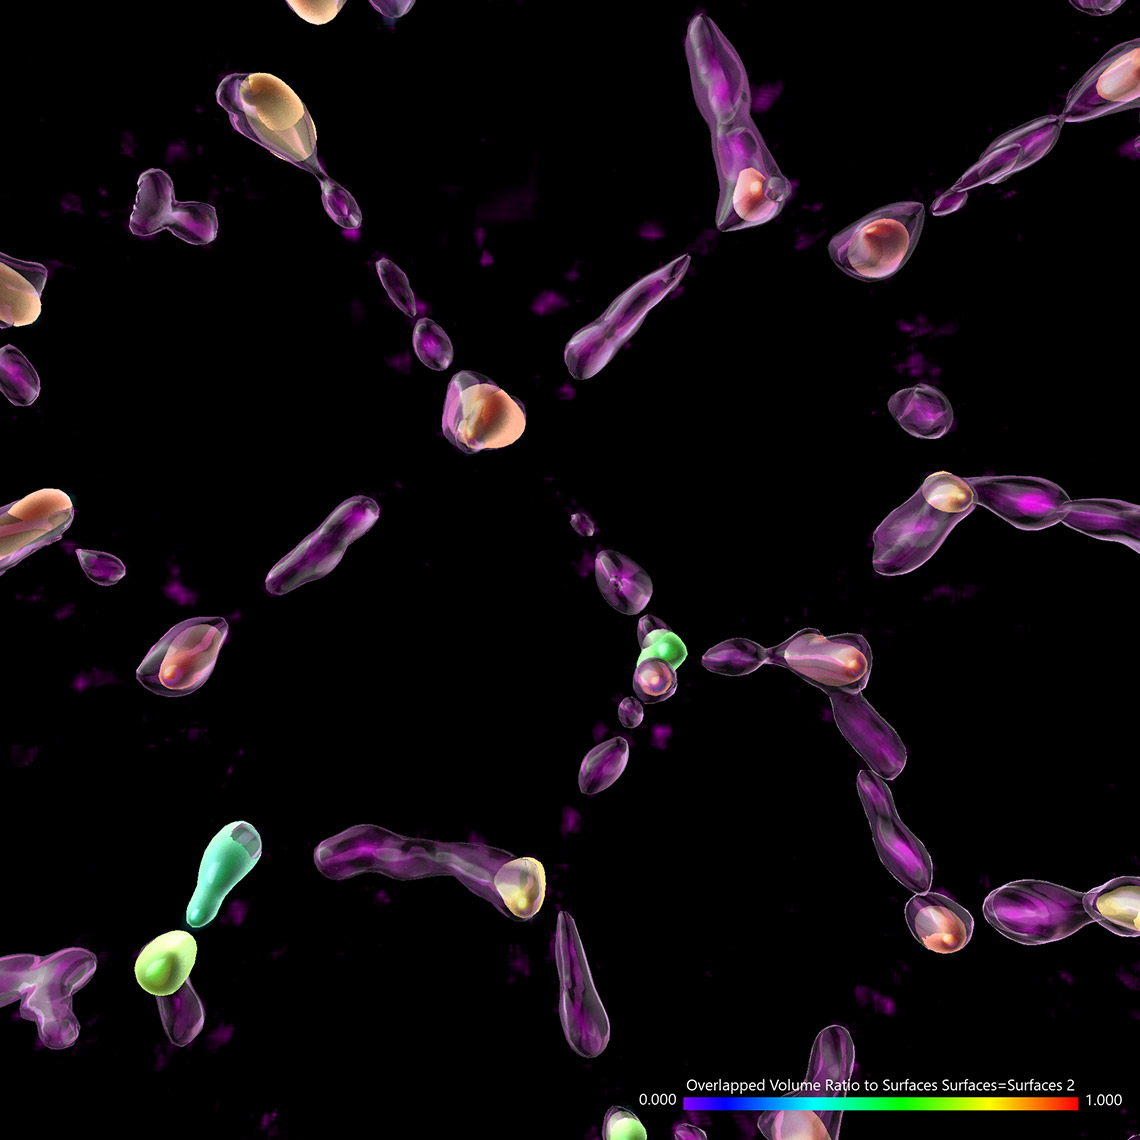
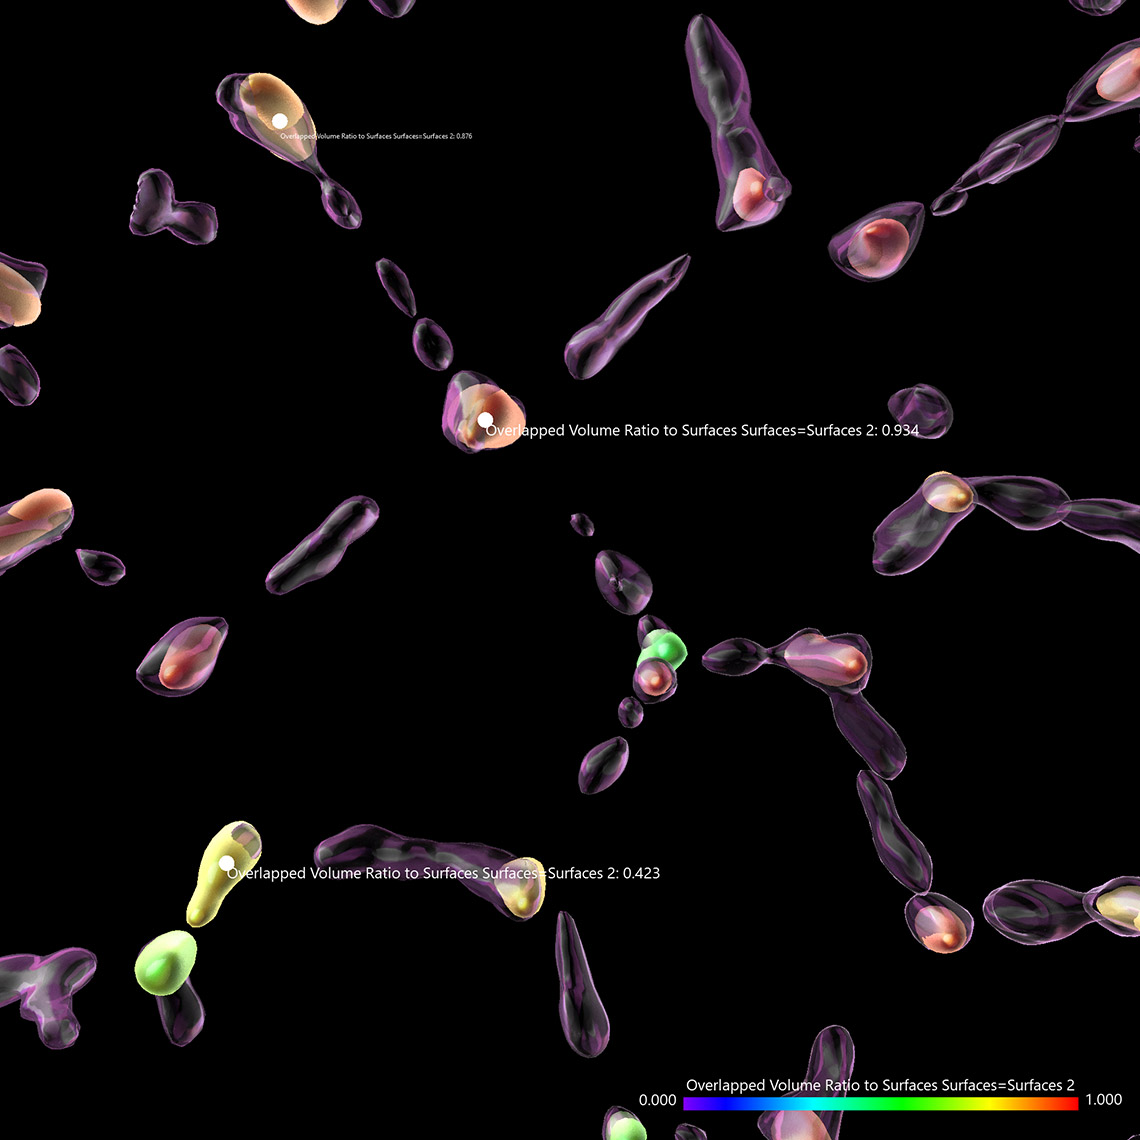
Try Imaris 9.7 for FreeImaris 9.7 enables the measurement of protein overlap using two new statistics: Overlapped Volume and Overlapped Volume Ratio. Both statistics are automatically calculated for every Surface object and can be used for classification, filtering, and color-coding. In time-lapse datasets the overlap region is calculated for every time point so the changes in the overlap ratio and volume can be as well used to define classes and events (changing classes). To do this analysis in Imaris you need to create 2 Surface objects (one for each protein) and read the Overlapped Volume and Overlapped Volume Ratio for each Surface in Detailed Statistics.
Images courtesy of: Dr. Teresa Bonello in Mark Peifer’s lab, UNC Chapel Hill
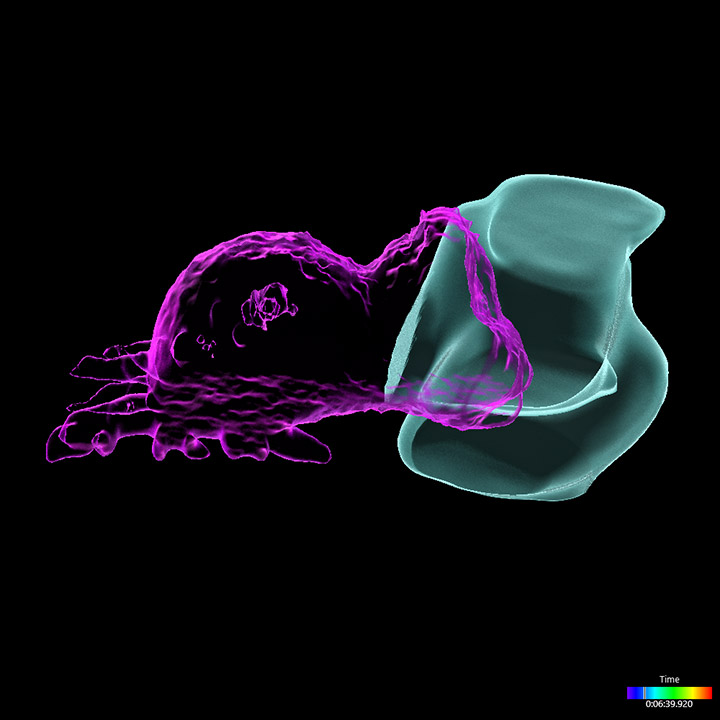
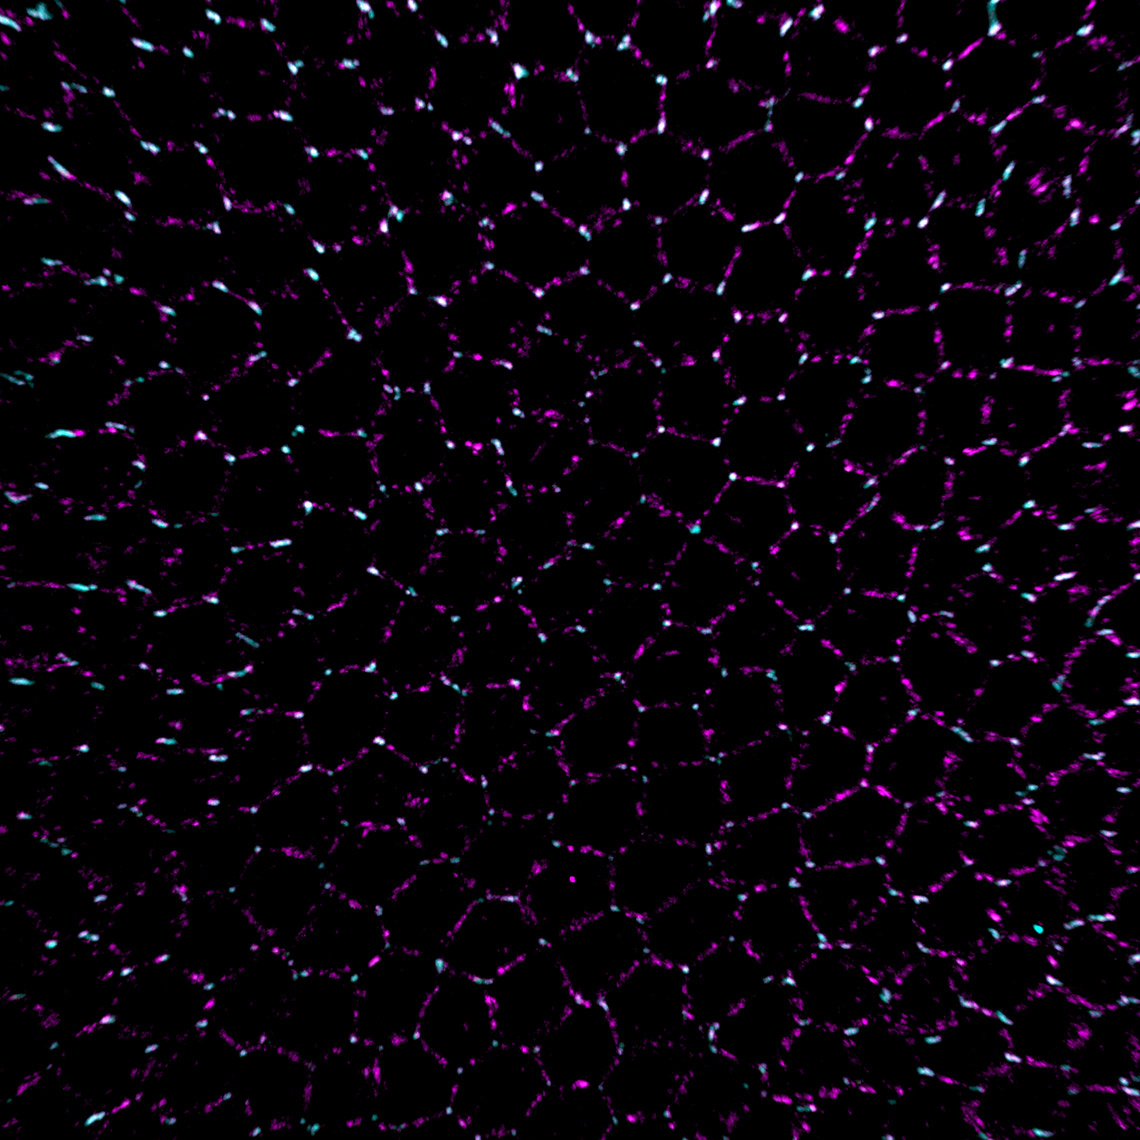
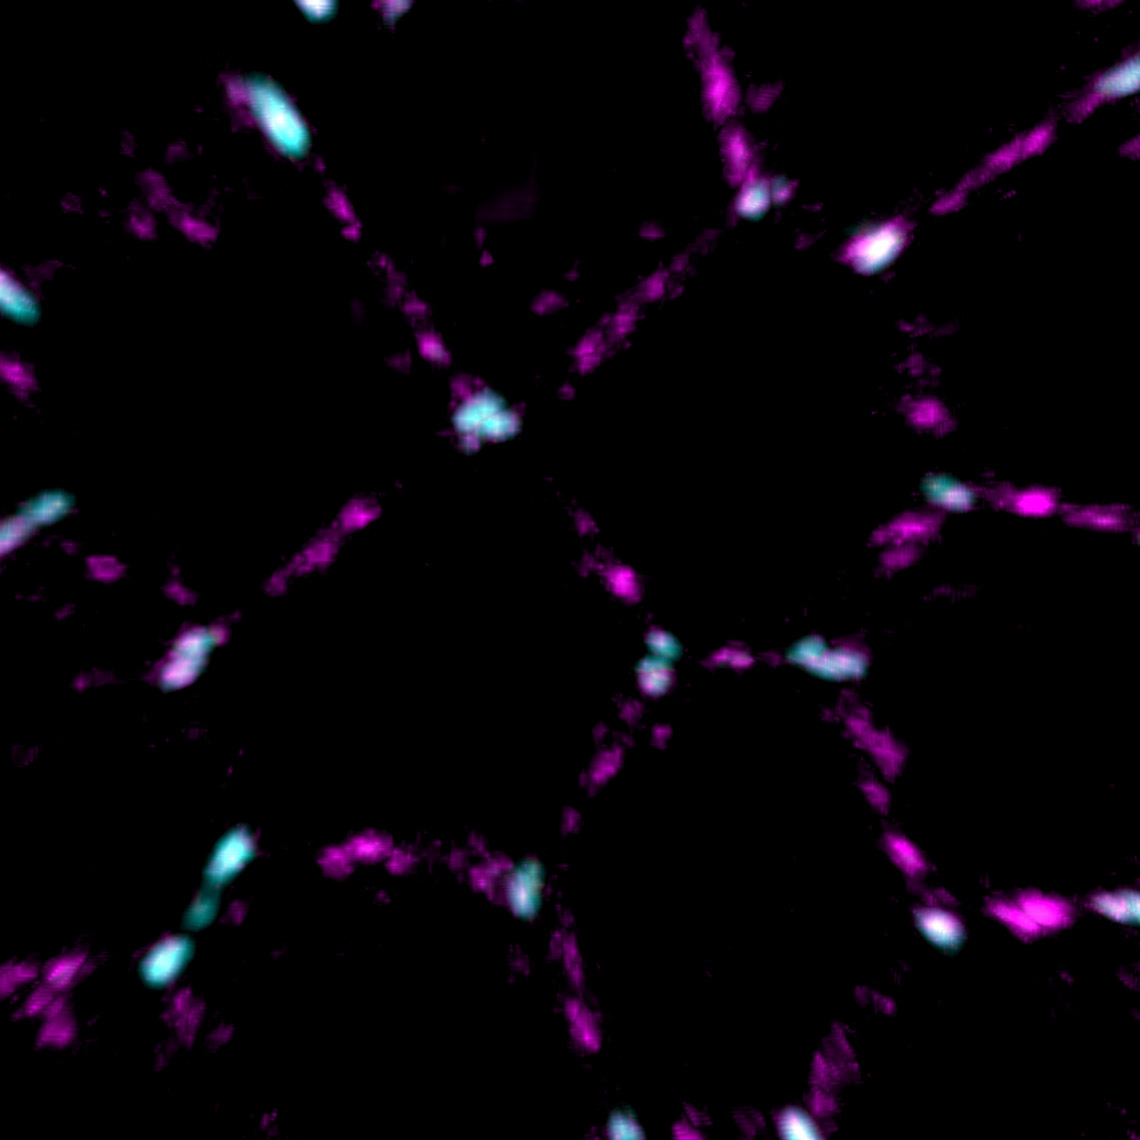
Mitochondrial networks and actin filaments can be visualized inside the cell using Dragonfly System with SRRF technology and iXon camera (left image). In Imaris 9.7 you gain more insight about the spatial relation between the mitochondrial network and actin filaments. Imaris Vantage generates an intensity profile plot in all directions around any given surface for each channel. In the example below, the actin filaments (yellow) were segmented with the Surface component and an intensity plot outside the Surface is displayed for the for the mitochondrial network (magenta channel). Knowing that the mitochondria signal can be found inside the surface created around the actin structure, one can as well check the Volume overlap at this resolution between the mitochondria structures and actin filaments and color-code the parts of mitochondria networks based on overlapped volume (purple – least overlapped, red – most overlapped)
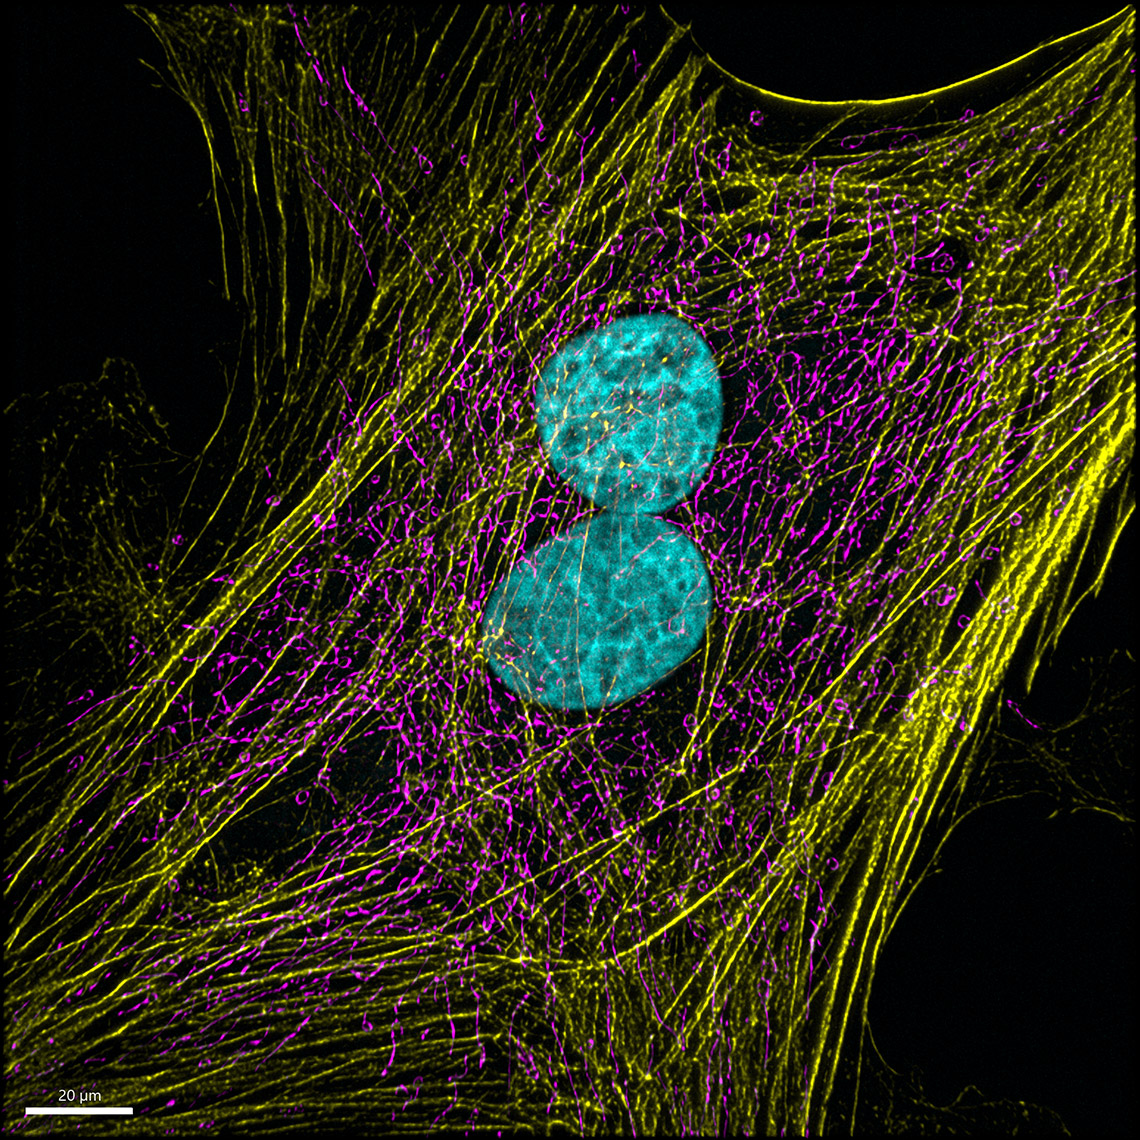
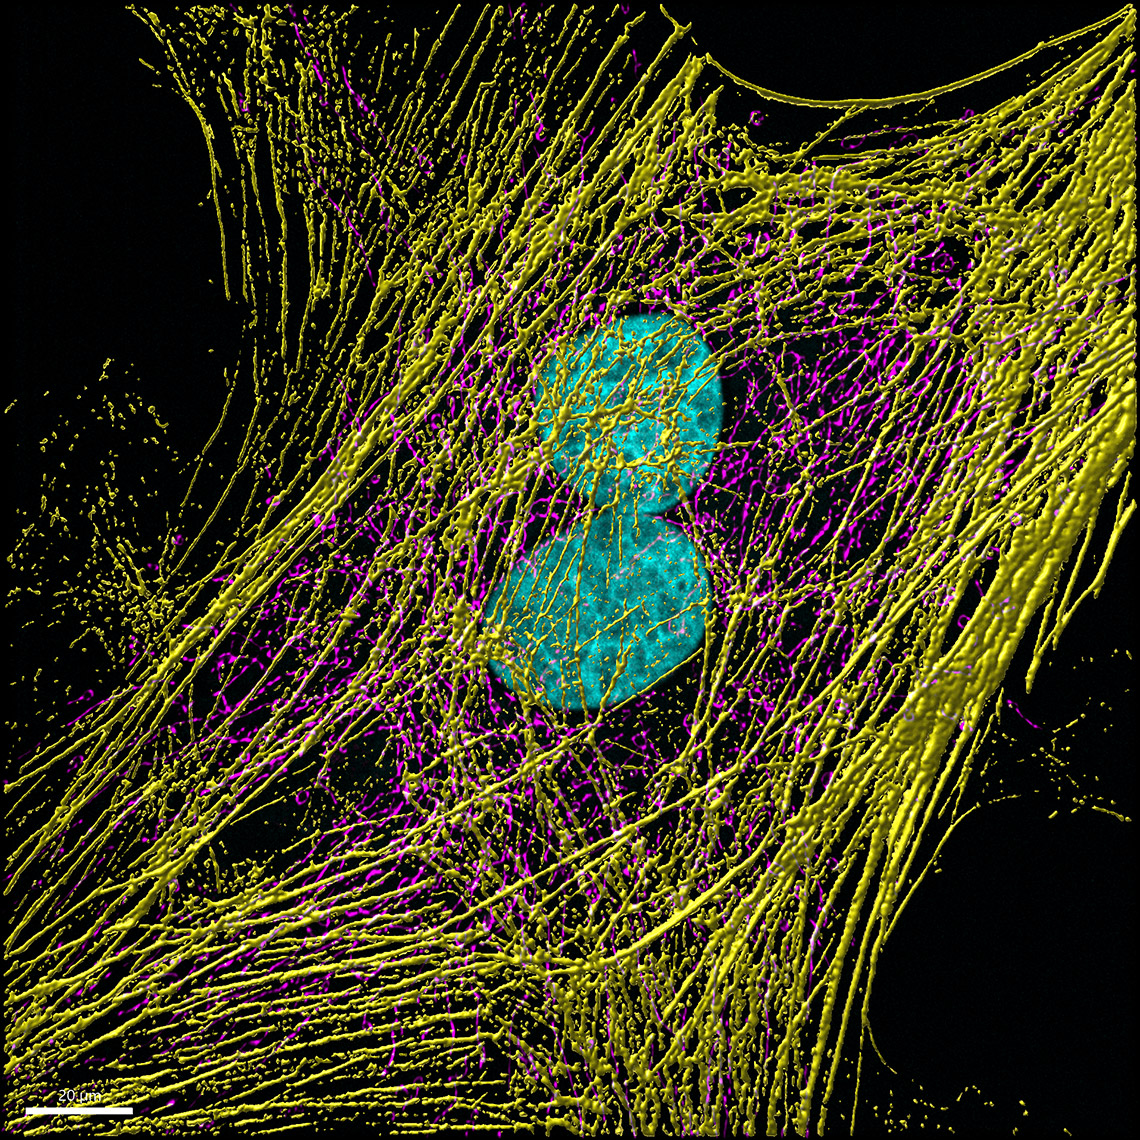
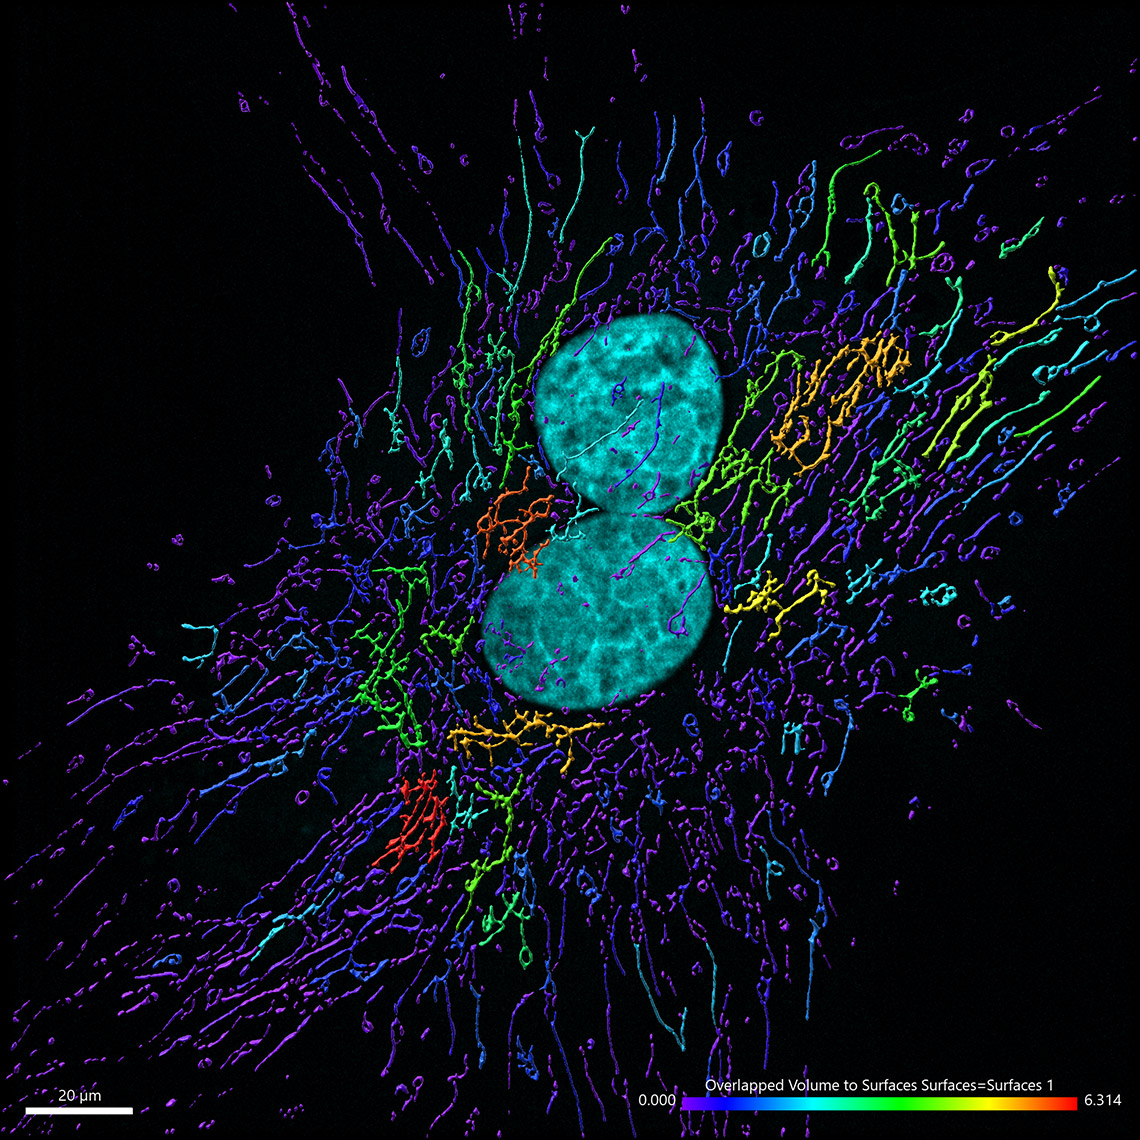

Image courtesy of: Dr. Claudia Florindo, Andor, An Oxford Instruments Company, Belfast, UK
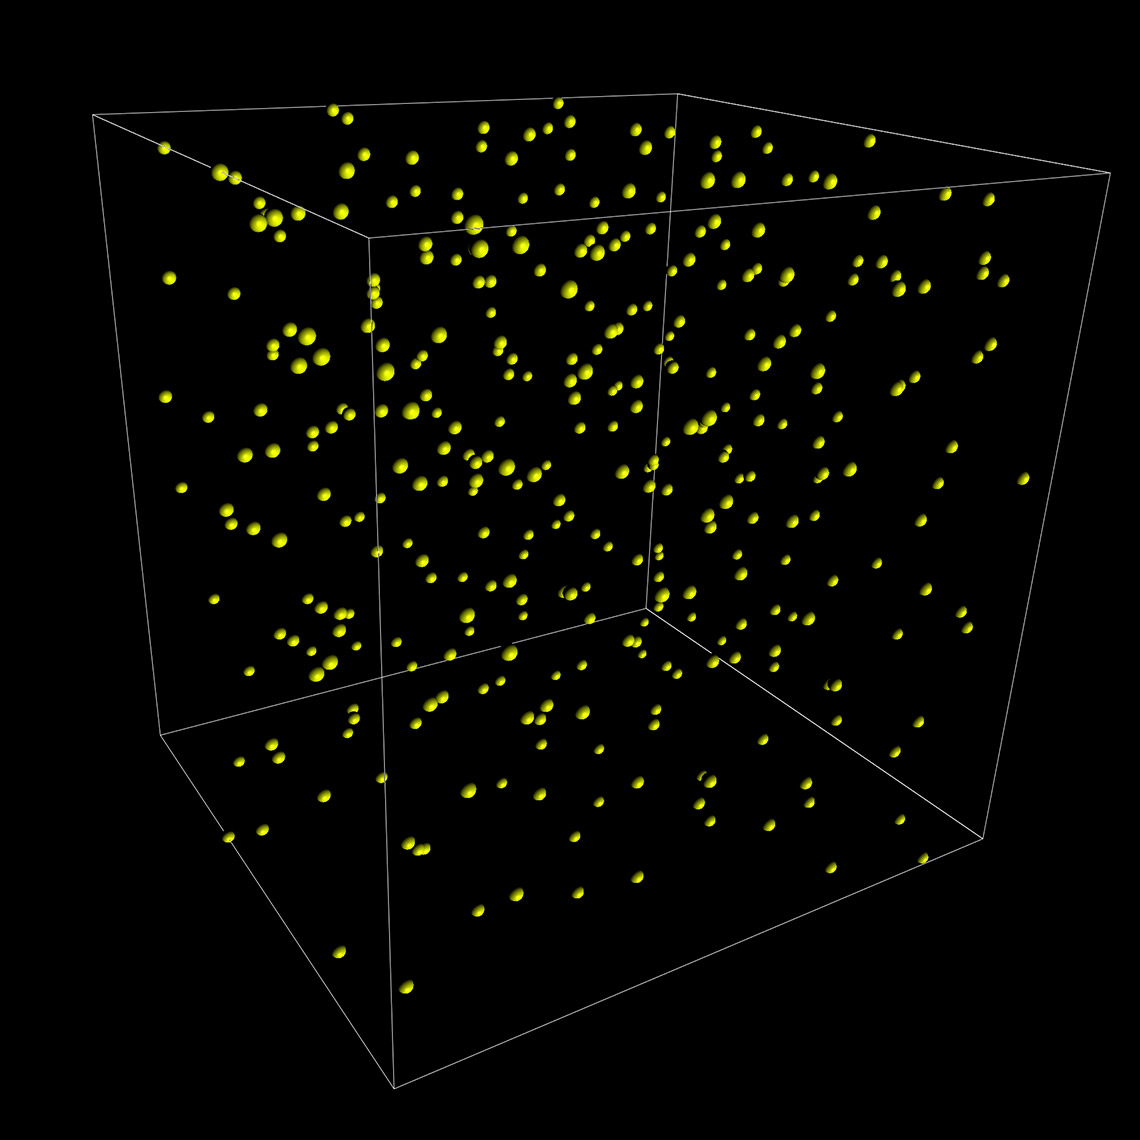
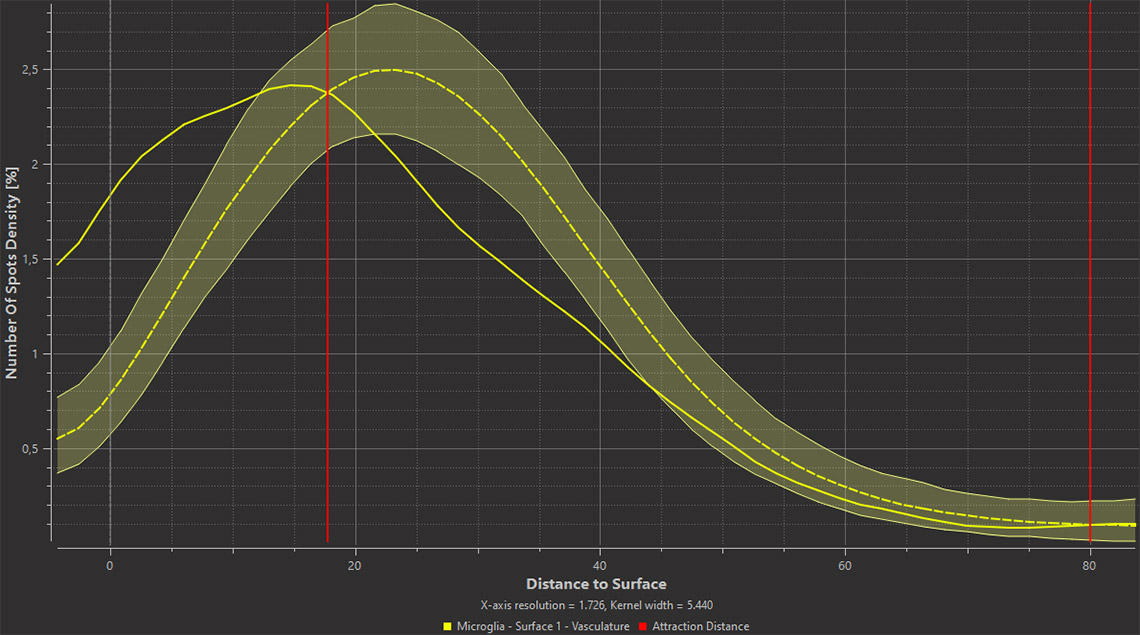
Imaris 9.7 opens a new way to analyze the potential attraction between two groups of objects where one can be characterised as a surface (blood vessels) and another as points (microglia). Imaris automatically simulates the random distribution of point like objects outside or inside the surface object and compares the randomised distribution with the observed microglia distribution in the same space. Within the new Vantage Spatial View a Density plot displays the distribution of distances from observed points (microglia) to the tissue of interest (vessels). The observed values are shown as a solid line and randomised objects are shown as a dashed line (see below). An attraction or repulsion can be concluded if the observed (solid line) is outside the confidence interval band of the randomised distribution (dashed line). In addition, attraction distance is calculated and represented as a vertical red line (see below) to assess within which distance objects are attracted to or repulsed from the surface.
This Imaris method was adapted from the approach published by Gomariz et al. 2018: https://www.nature.com/articles/s41467-018-04770-z Gomariz, Alvaro, Patrick M. Helbling, Stephan Isringhausen, Ute Suessbier, Anton Becker, Andreas Boss, Takashi Nagasawa et al. "Quantitative spatial analysis of haematopoiesis-regulating stromal cells in the bone marrow microenvironment by 3D microscopy." Nature communications 9, no. 1 (2018): 1-15
To perform this analysis in Imaris you simply first detect vessels as Surfaces and microglia as Spots. The additional analysis is automatically calculated for you in the background and presented within the Imaris Vantage module.
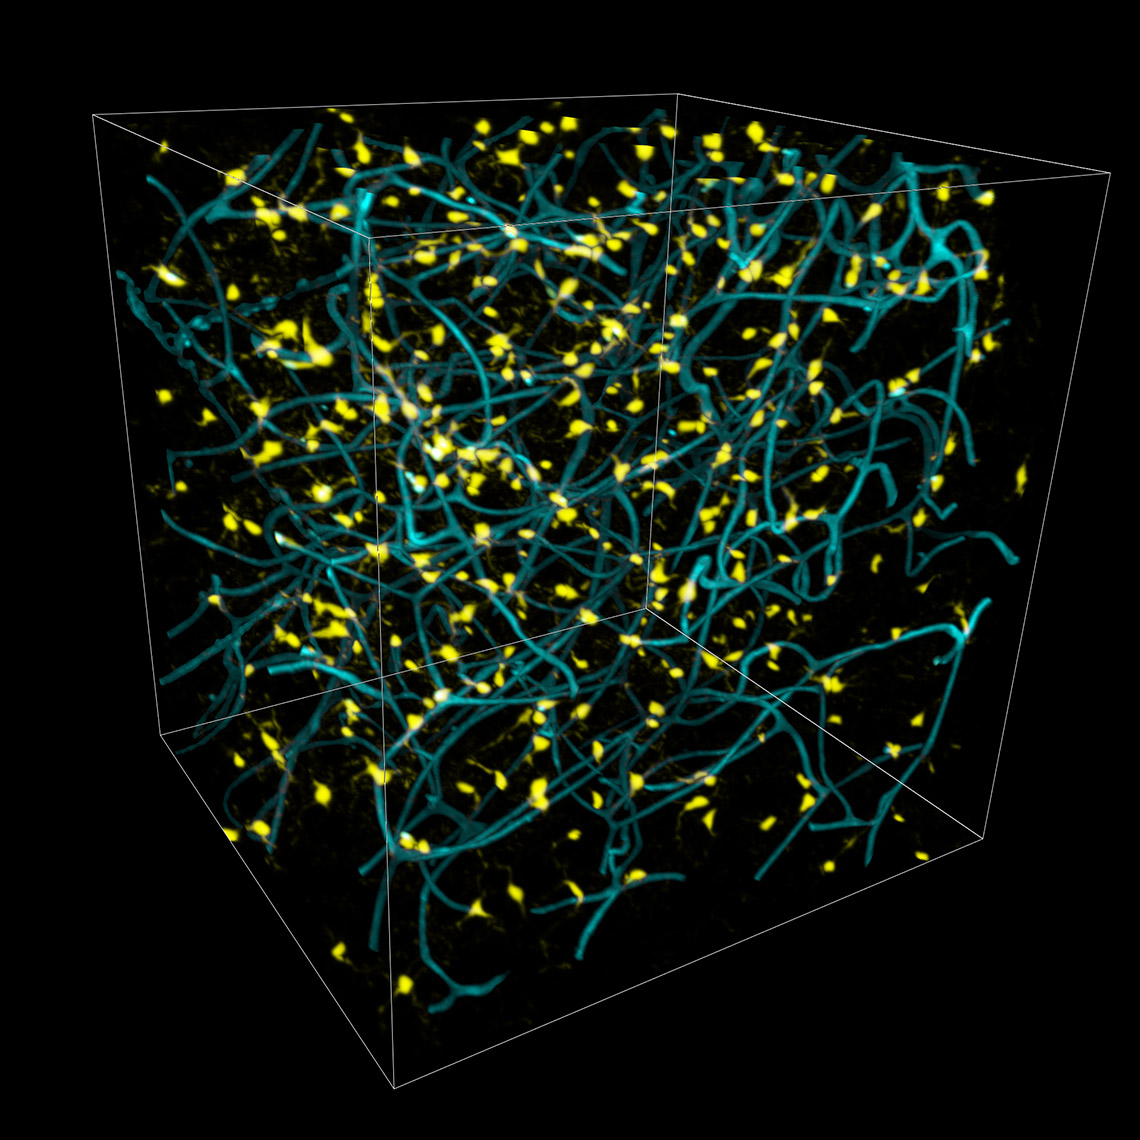
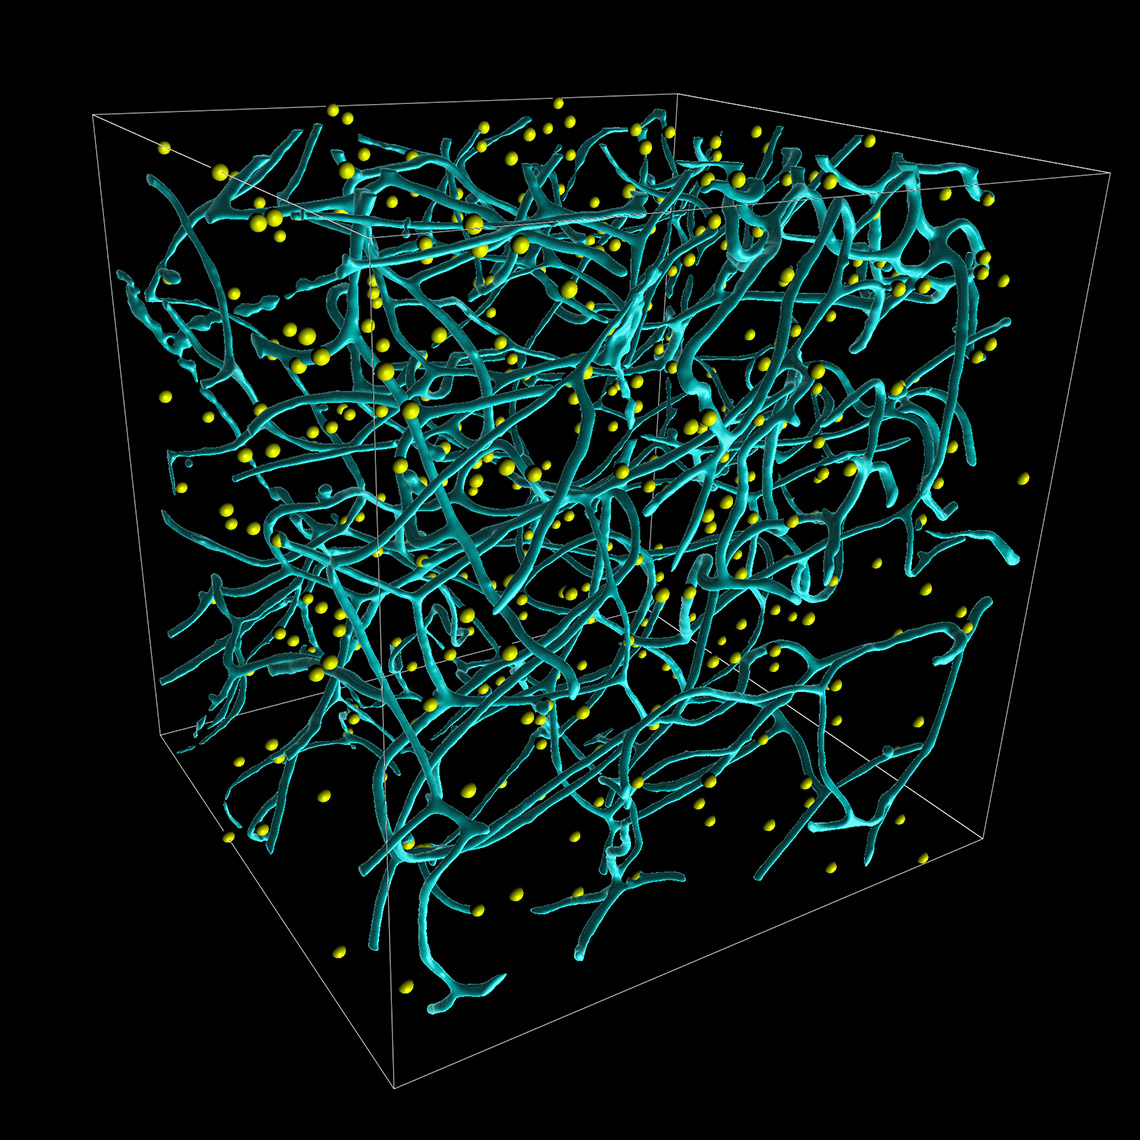
Images courtesy of Dr. Matthew Kofron, Division of Developmental Biology, Cincinnati Children’s Hospital Medical Center, Cincinnati, OH, USA
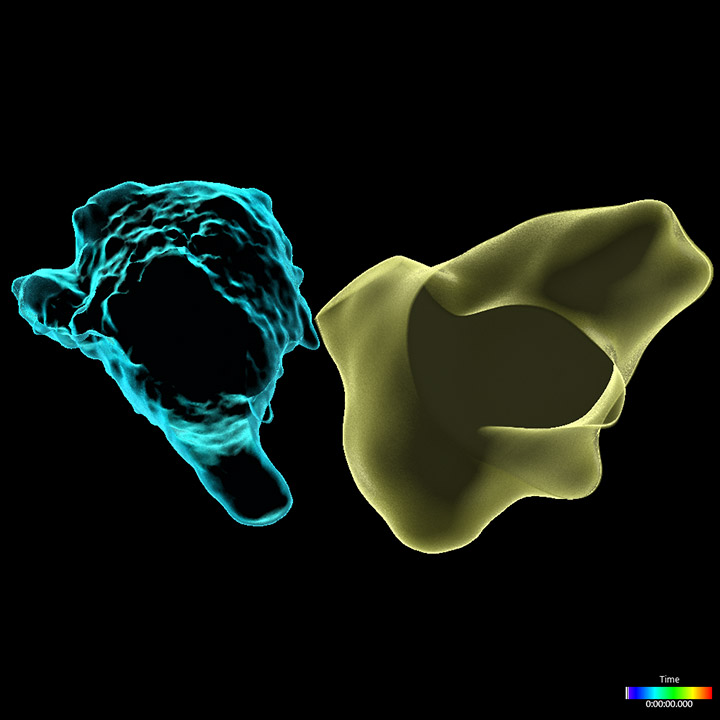
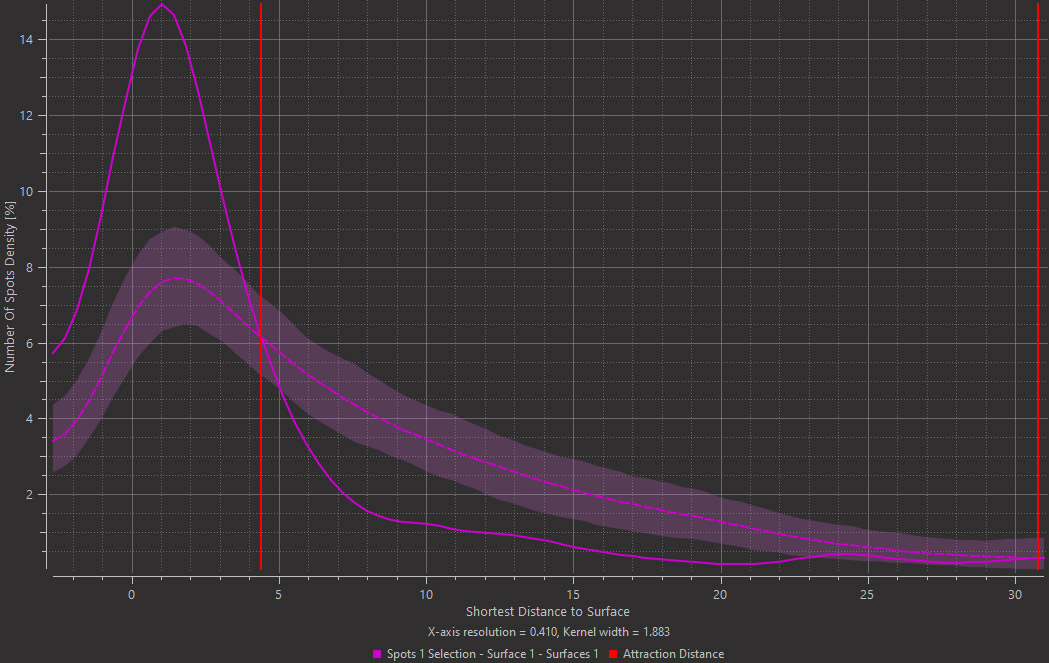
Imaris 9.7 offers an efficient method to analyse the spatial distribution of two classes of object and determine if an attraction exists between them. You can assess if plaques are more likely found around microglia nuclei. In the left image below you see the plaques in yellow, microglia stained in magenta and nuclei in cyan. First, detect the nuclei of microglial cells using the Imaris Machine Learning Object Classifier in this case (magenta Spots are microglia nuclei and cyan Spots are other nuclei). Next, detect plaques (yellow) as Surfaces and Imaris will automatically simulate a random distribution of point like objects outside and inside plaques (yellow Surface). Imaris then displays a comparison of the observed microglia nuclei distribution (solid line on the plot) with the simulated Spots distribution (dashed line) in the same space. From the distance plot you can conclude that the observed microglia nuclei are more likely found around plaques up to ~4 µm from their surface (attraction distance represented as a red vertical line) when compared to the simulated distribution.
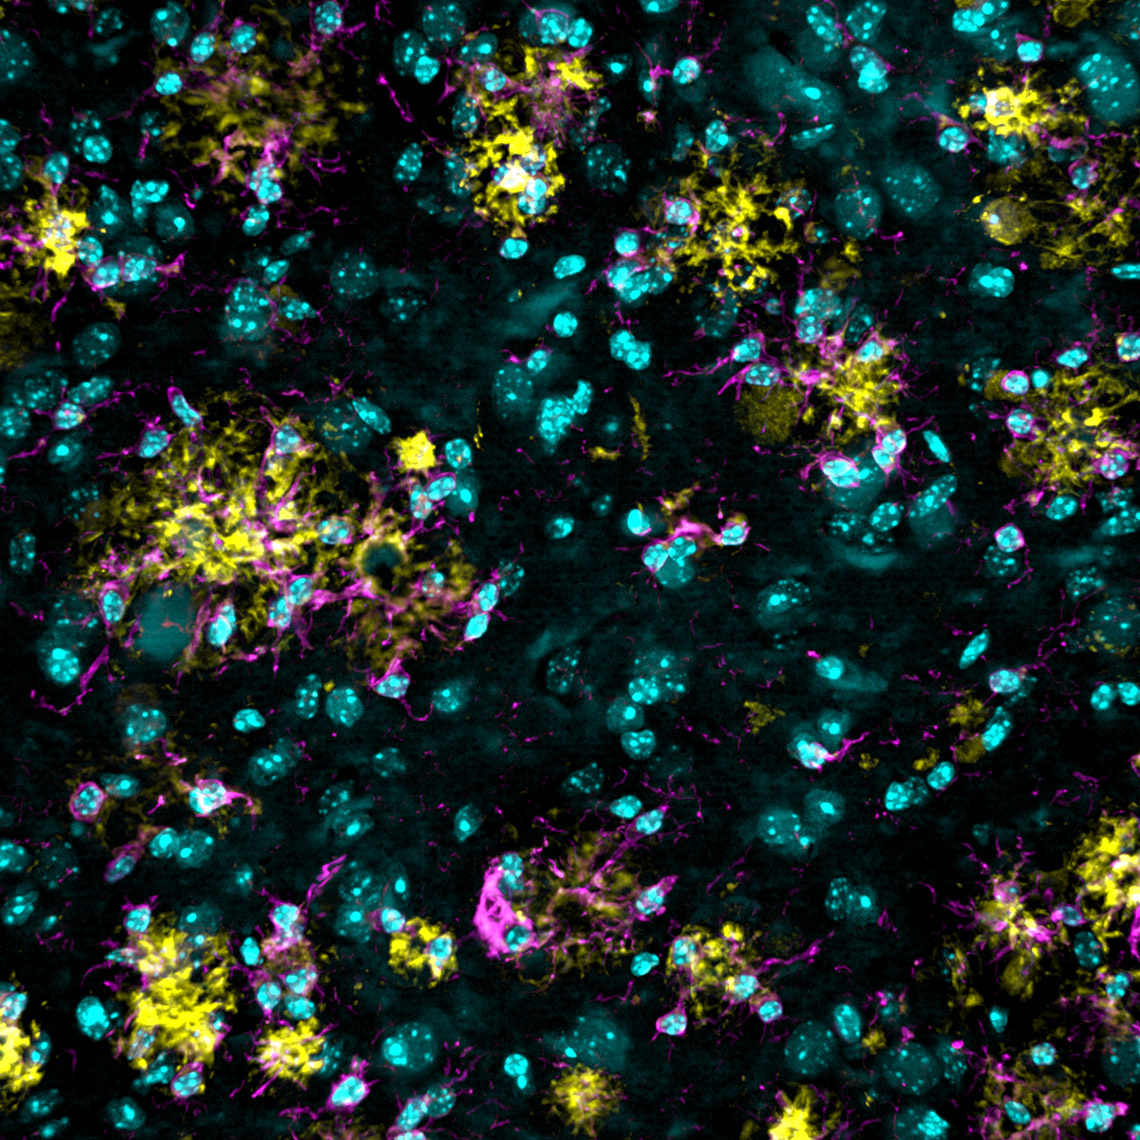

Images courtesy of Dr. E. C. Pietronigro & Dr. G.Constantin, University of Verona, Italy
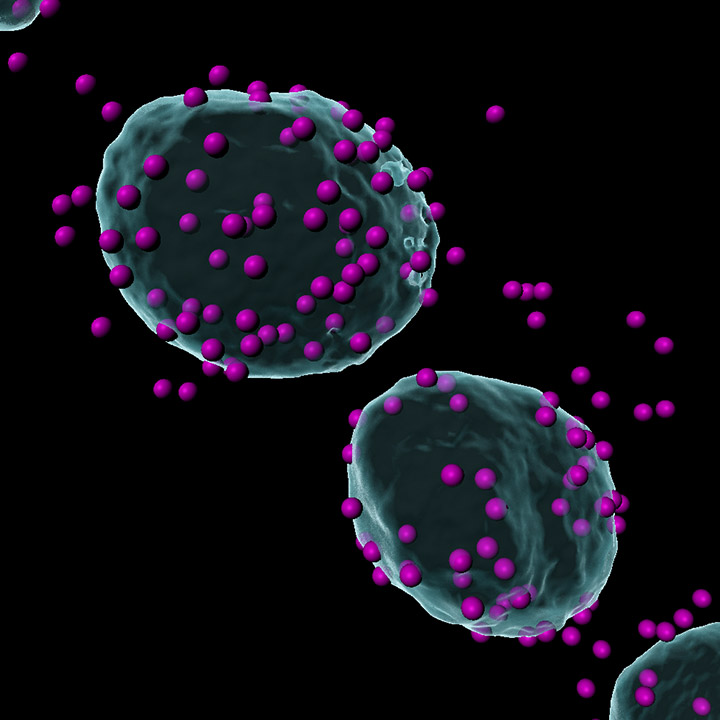
Within Imaris 9.7 you can classify a population of cells according to any of our measurements. In this case you would classify your cells by based on their Shortest distance to the nearest neighbour of another population of cells. Within the raw data below (left) there are 2 populations of cells: cyan and yellow. In Imaris 9.7 the duration of how long cyan cells were found within the 3 μm distance from the yellow cells is now automatically calculated. Within the analysed image (right), cyan cells found within 3μm of the yellow cells are magenta coloured.
To perform this analysis in Imaris detect both cell types using Spots or Surfaces depending on which models which best describe your image) and decide what type of contact is interesting for you (overlap, touching or proximity). During object creation define 2 Classes: in contact and not in contact. Then the Class Duration statistics is automatically calculated in Imaris.
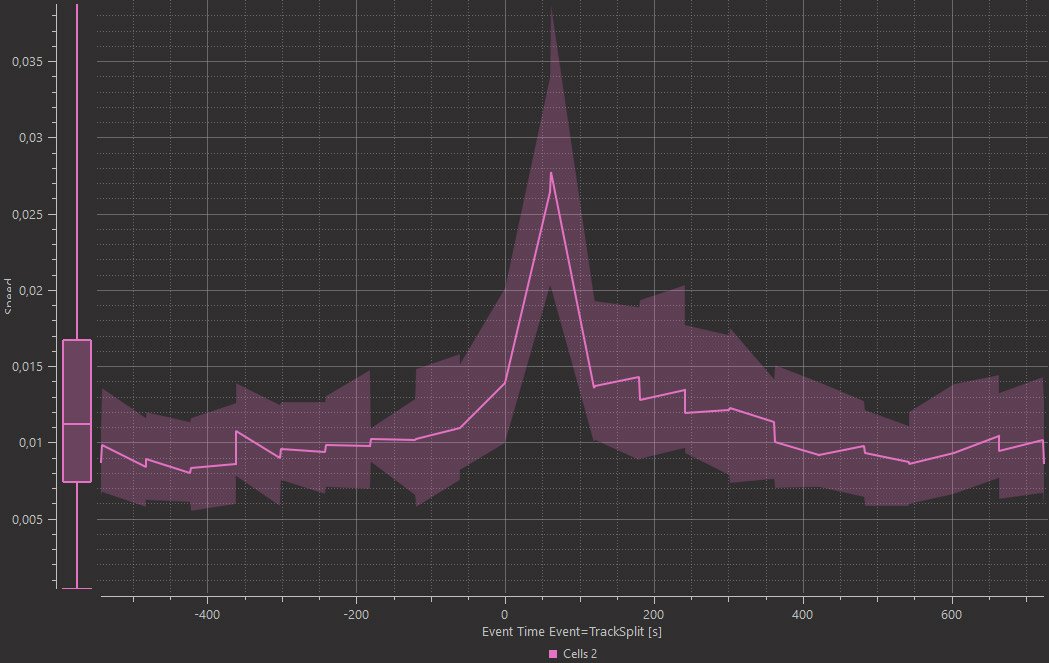
Whether occurring in a developing embryo or cultured cells in a dish, cell divisions are often observed at different moments in time. To analyse changes relative to the cell cycle, such as intensity, speed, or morphology changes, Imaris automatically adds an Event when the tracks split and Imaris Vantage Time View aligns all measurements to that event (time axis is divided into two parts: before and after the event), so you can easily observe parameter changes across many tracks and events, around the time the cells divided. To answer this question, detect cell nuclei as Surfaces and track them using the Lineage Tracking algorithm. Imaris classifies each cell division as an Event and within the Time Plot in Vantage the time axis is aligned to the Event and divided into time before and time after the Event.
Images courtesy of Dr. Matthew Kofron, Division of Developmental Biology, Cincinnati Children’s Hospital Medical Center, Cincinnati, OH, USA.
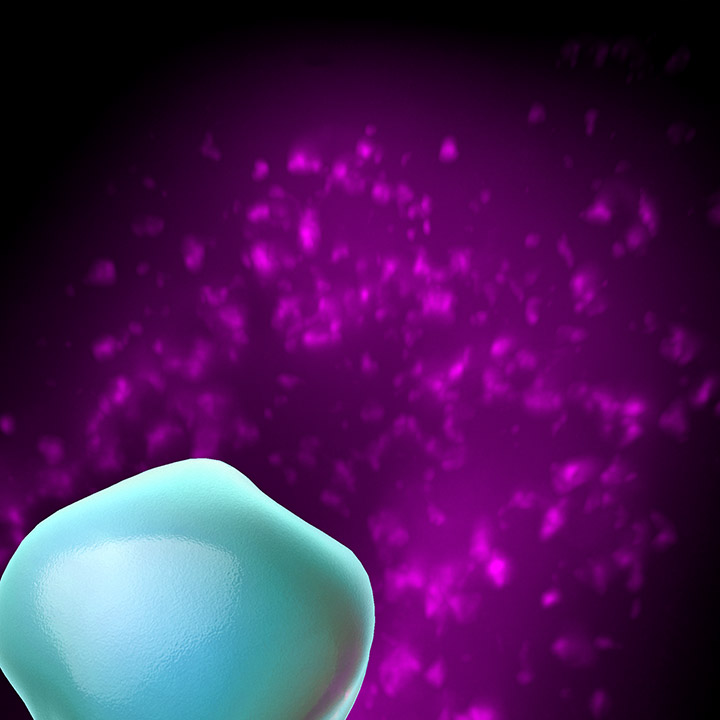
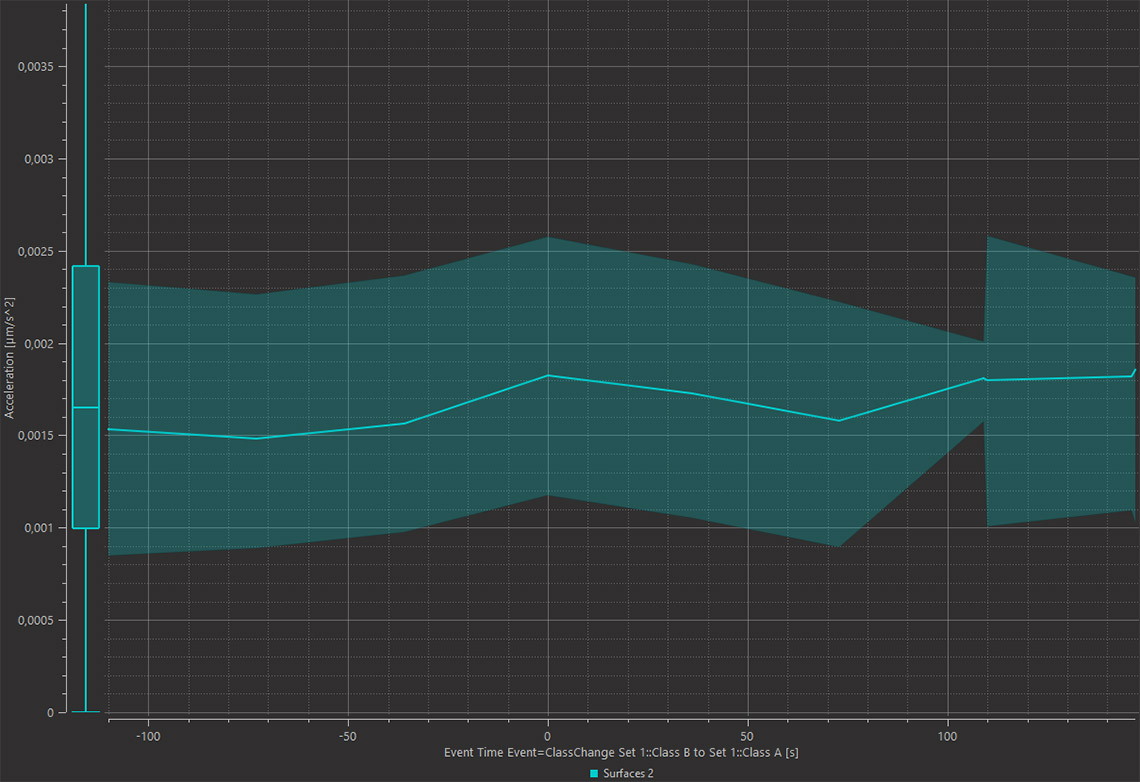
Imaris 9.7 adds a new option of analysing time lapse datasets and enables monitoring of subtle changes in the morphology or dynamics of objects when they meet other objects on the new Time View Vantage plot. Within the Time View Vantage plot the X axis can be aligned to an Event, which can be defined by a measurable change of any parameter calculated in Imaris. Here, the change in the Shortest Distance between the cyan labelled cells and the microglia. To do this analysis in Imaris you need to detect both cell types using Spots or Surfaces, whichever models best describe your image, and decide what type of contact is interesting for you (overlap, touching or proximity). Then define Classes based on a contact measurement value (e.g. within 1um). From there, define the Event as a change from one Class to another and observe your result within the Time View Vantage plot. In this example Surface was created around magenta cells and cyan cells. Cyan Surfaces change their color into yellow once they start touching magenta cells. The Time View plot shows a small transient increase in cyan cell Acceleration around the time when cells became in contact.
The Imaris Learning Center hosts a wide range of tutorial videos, how-to articles and webinars to guide you through the many features of Imaris. We have provided some links below which will get you started on some of our most recent developments.

© オックスフォード・インストゥルメンツ 2026