Powered by Bioz
Motion Analysis
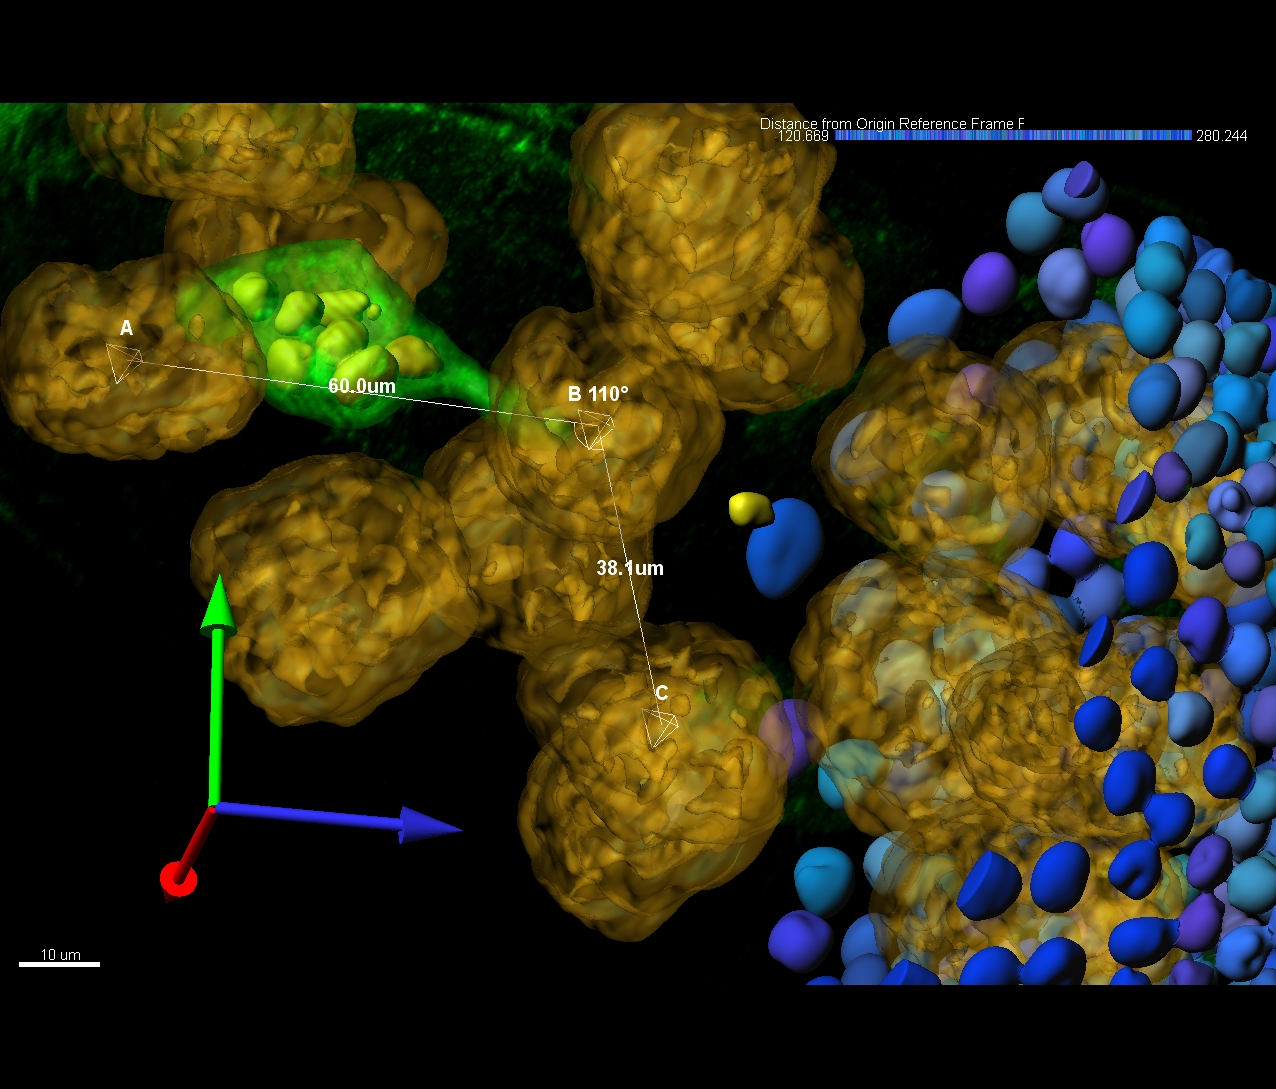
- Length
- Mean Diameter
- Branching Angle
- Spine Density
- Resistance
 オックスフォード・インストゥルメンツー事業部ページ

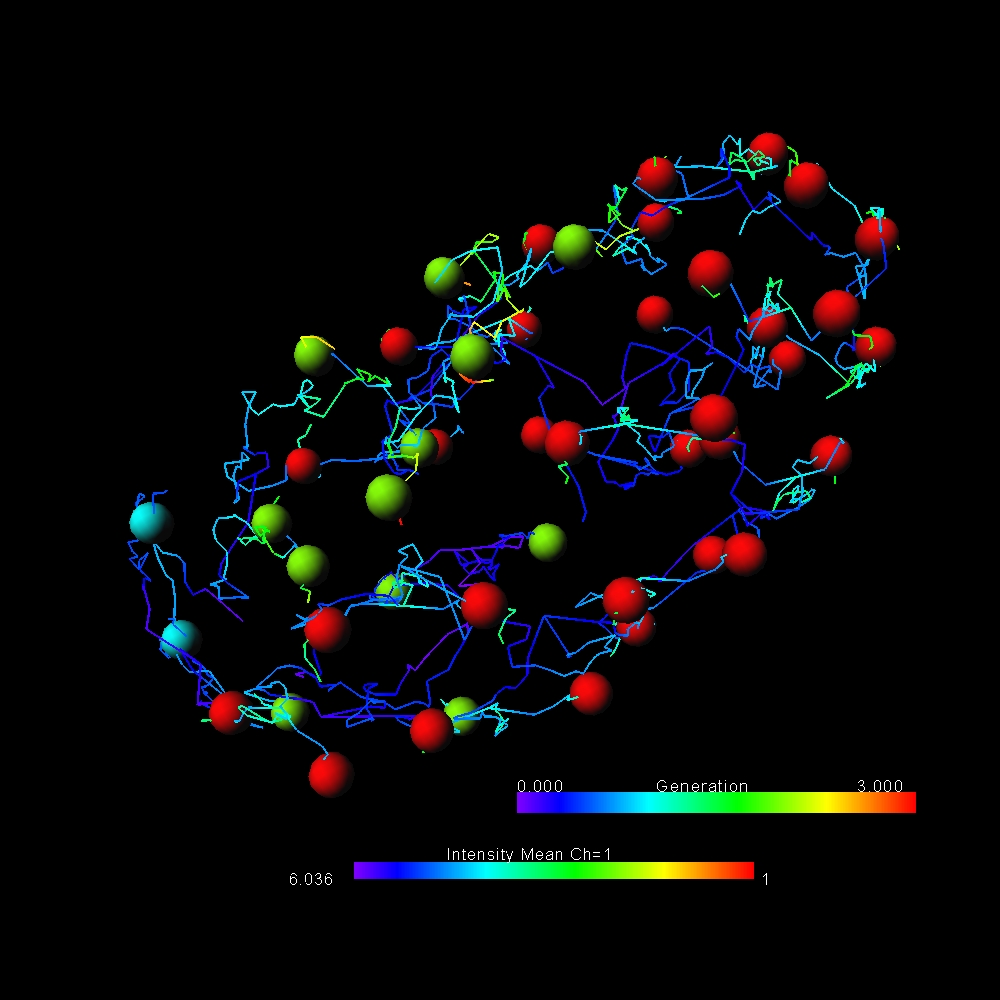
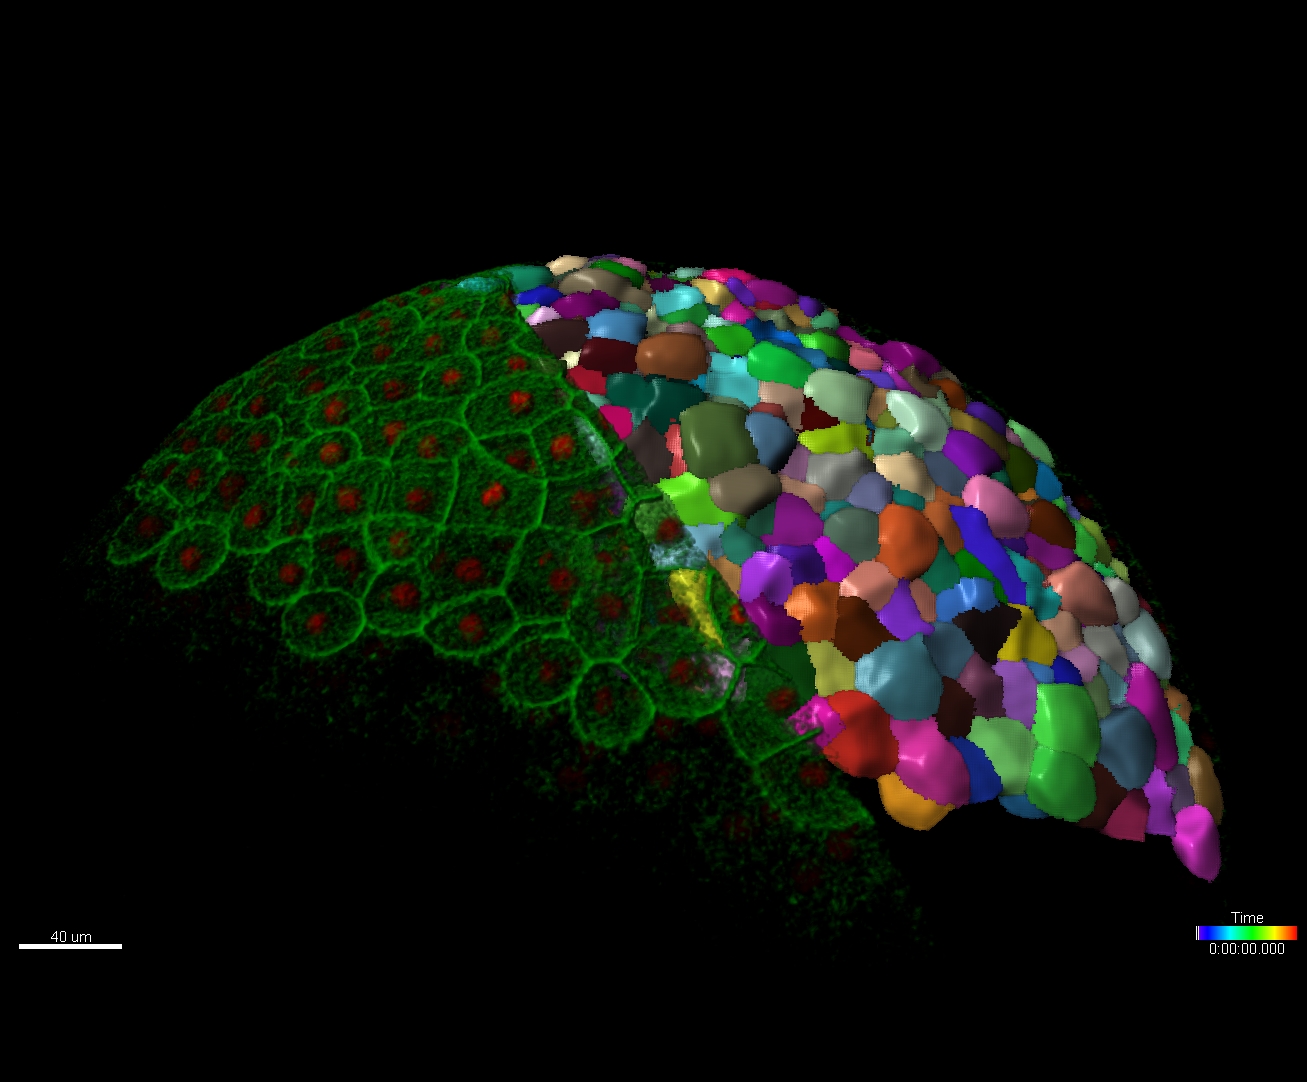
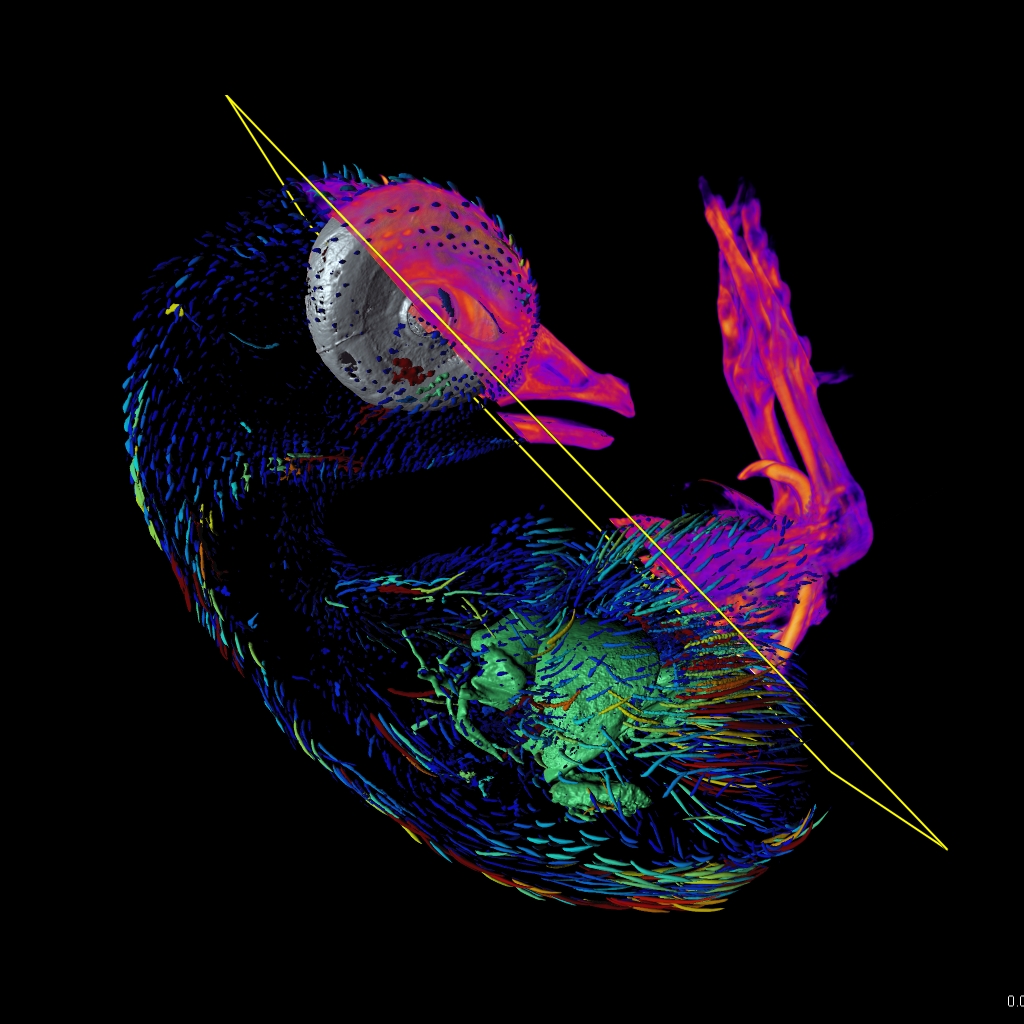
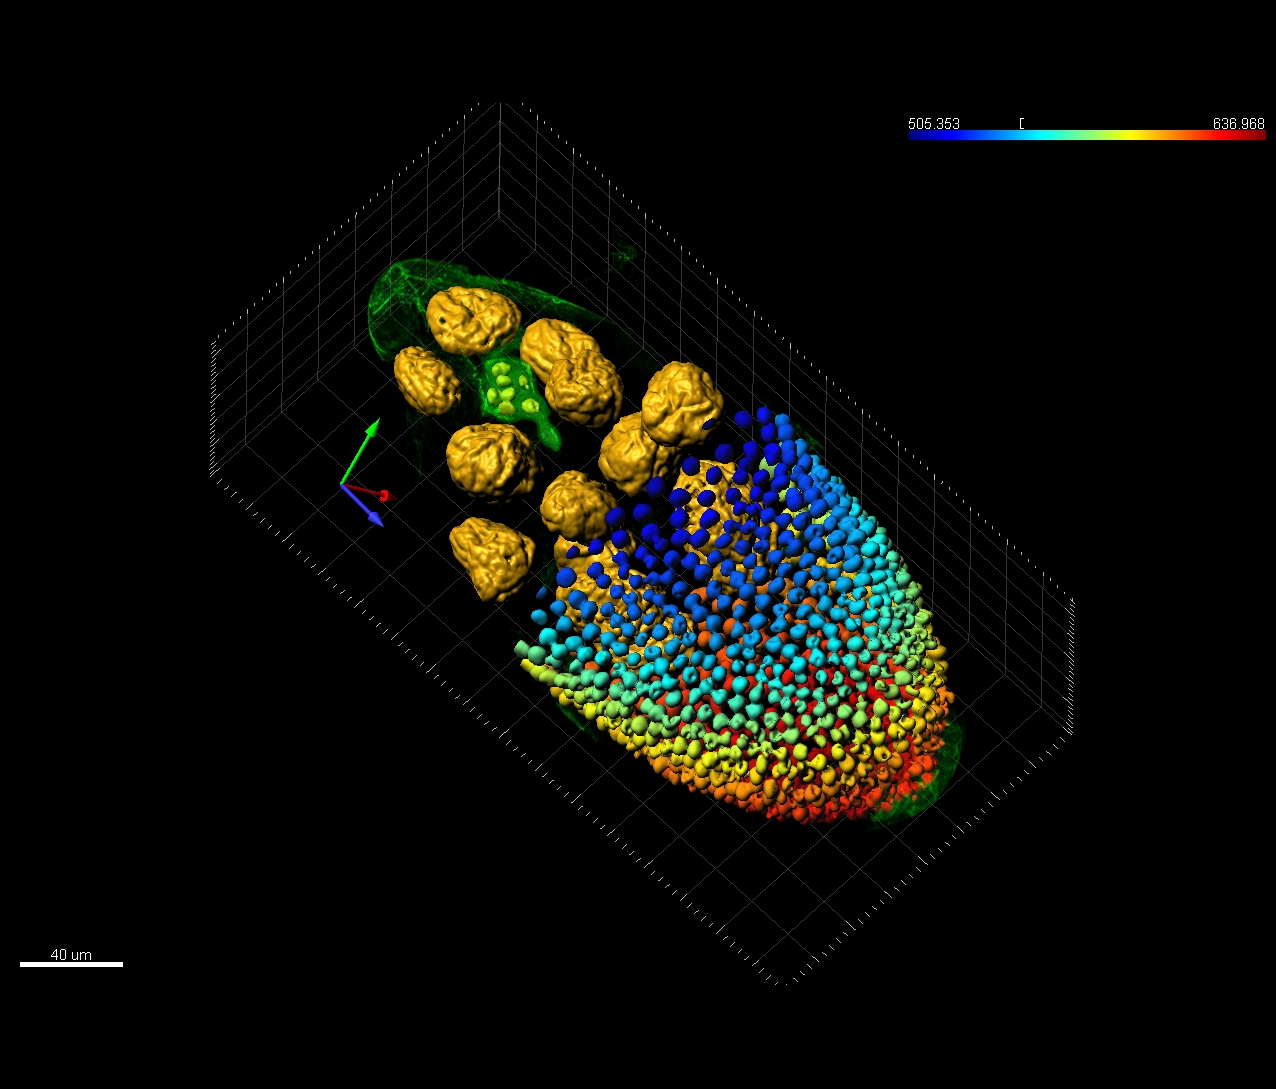
Imaris provides a complete set of features for visualization of multi-channel microscopy datasets from static 2D images to 3D time series regardless their size and format. Using Imaris for Neuroscientists users can:
The Imaris Learning Center hosts a wide range of tutorial videos, how-to articles and webinars to guide you through the many features of Imaris. We have provided some links below which will get you started on some of our most recent developments.

© オックスフォード・インストゥルメンツ 2026