オックスフォード・インストゥルメンツー事業部ページ
拡張

細胞生物学者のためのImaris

The Imaris for Cell Biologists package is ideal for researchers in several life science disciplines who require a broad range of functionalities to study cells and organisms. In addition to Imaris’ proven 3D/4D visualization and analysis tools, Imaris for Cell Biologists provides the functionality for smart cell based segmentation, analysis on a per cell basis and discovery of intracellular relationships. The package includes automated tracking, detection of cell division and creation of interactive lineage trees along with statistical tests and a two-way interface for customization in Matlab, Java or Python.

Request Pricing

細胞やオルガネラの自動検出

Imaris for Cell Biologists provides multiple options to detect and model your biologically relevant structures via step-by-step wizards with a preview of the results at each point in the workflow. 

表面

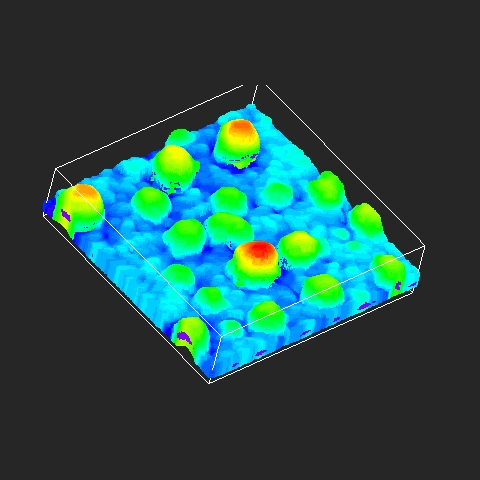
Use Imaris Surfaces to precisely visualize and measure organelles, nuclei, biofilms, cells, tissues, organs, embryos as well as organoids:

 
  • Computer-generated representations of a specified region of interest in the data set
  • Can be calculated and visualized for data sets up to hundreds of gigabytes in size (technology available from Imaris 9)
  • Act as a container from which all the desired statistics can be calculated
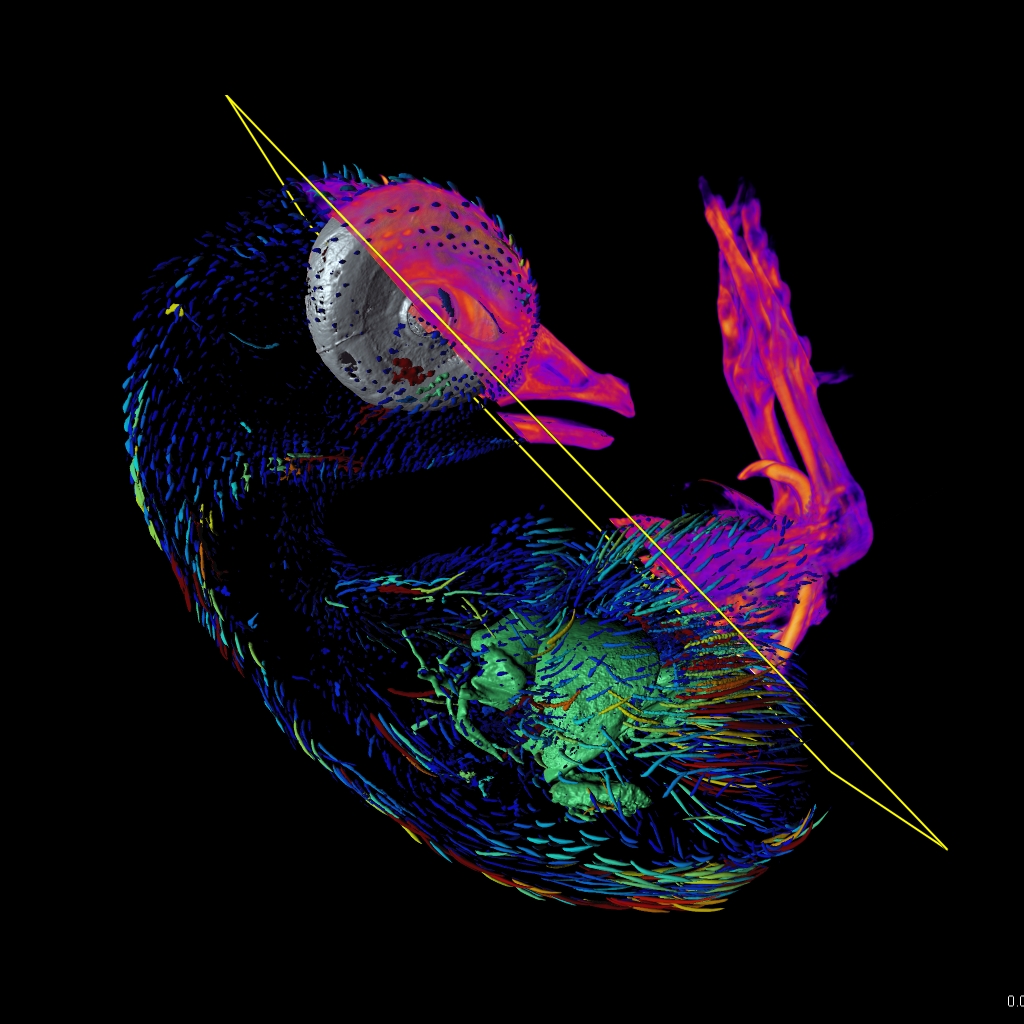
  • Can be tracked in time (position, shape and intensity changes)

スポット

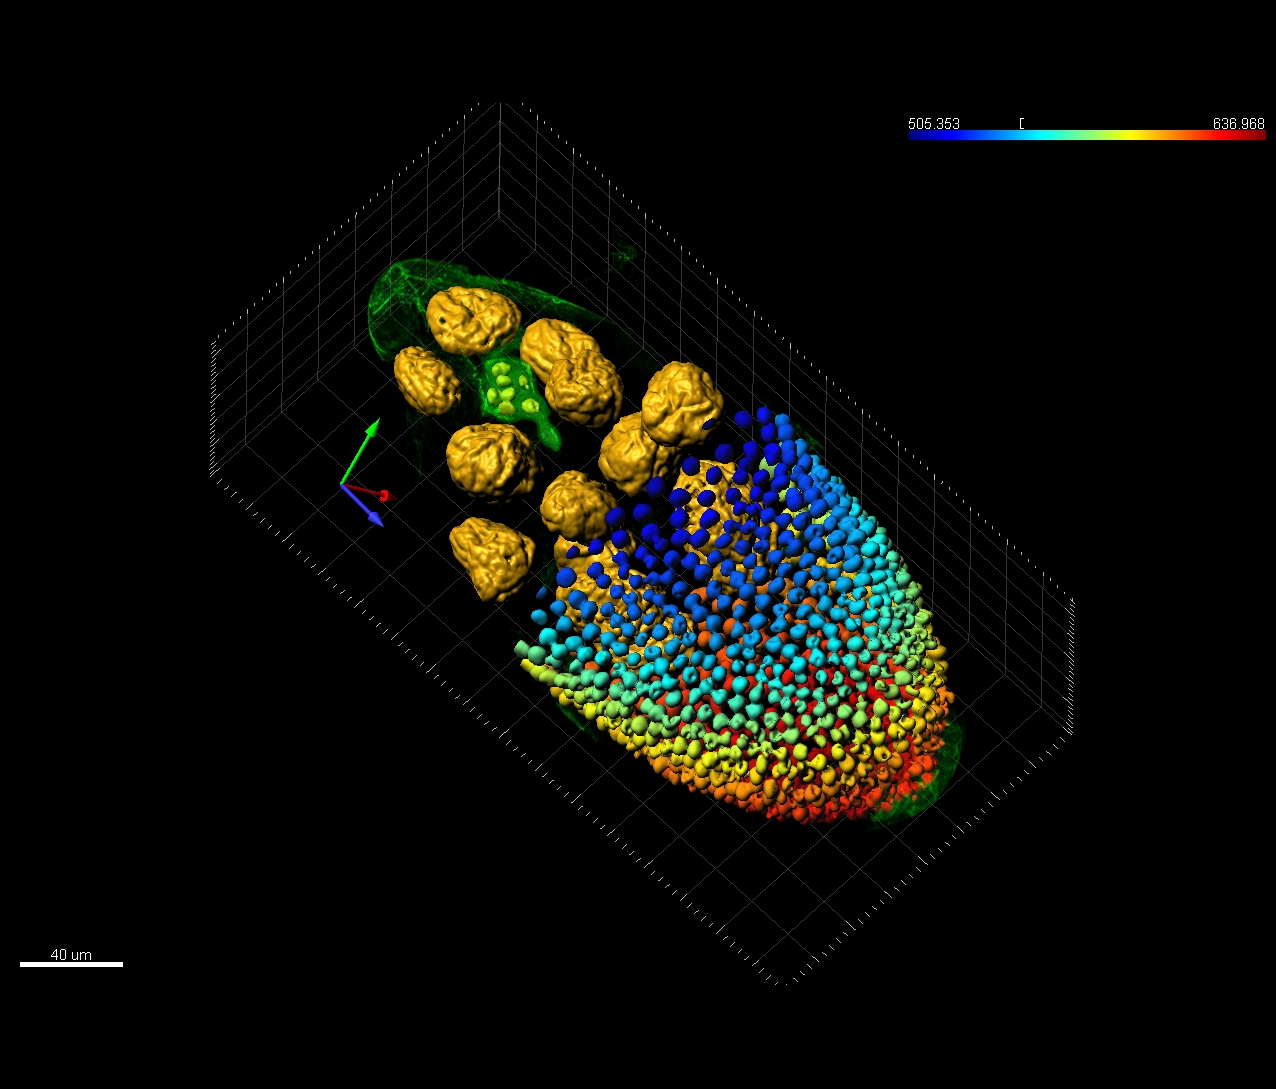
Use Imaris Spots to detect: particles, protein clusters, vesicles, nucleoli, nuclei, centrosomes, cells and bacteria.

 
  • Model point-like or vesicle-like structures in the data.
  • Can be identified in images with 10s or 100s of thousands of objects.
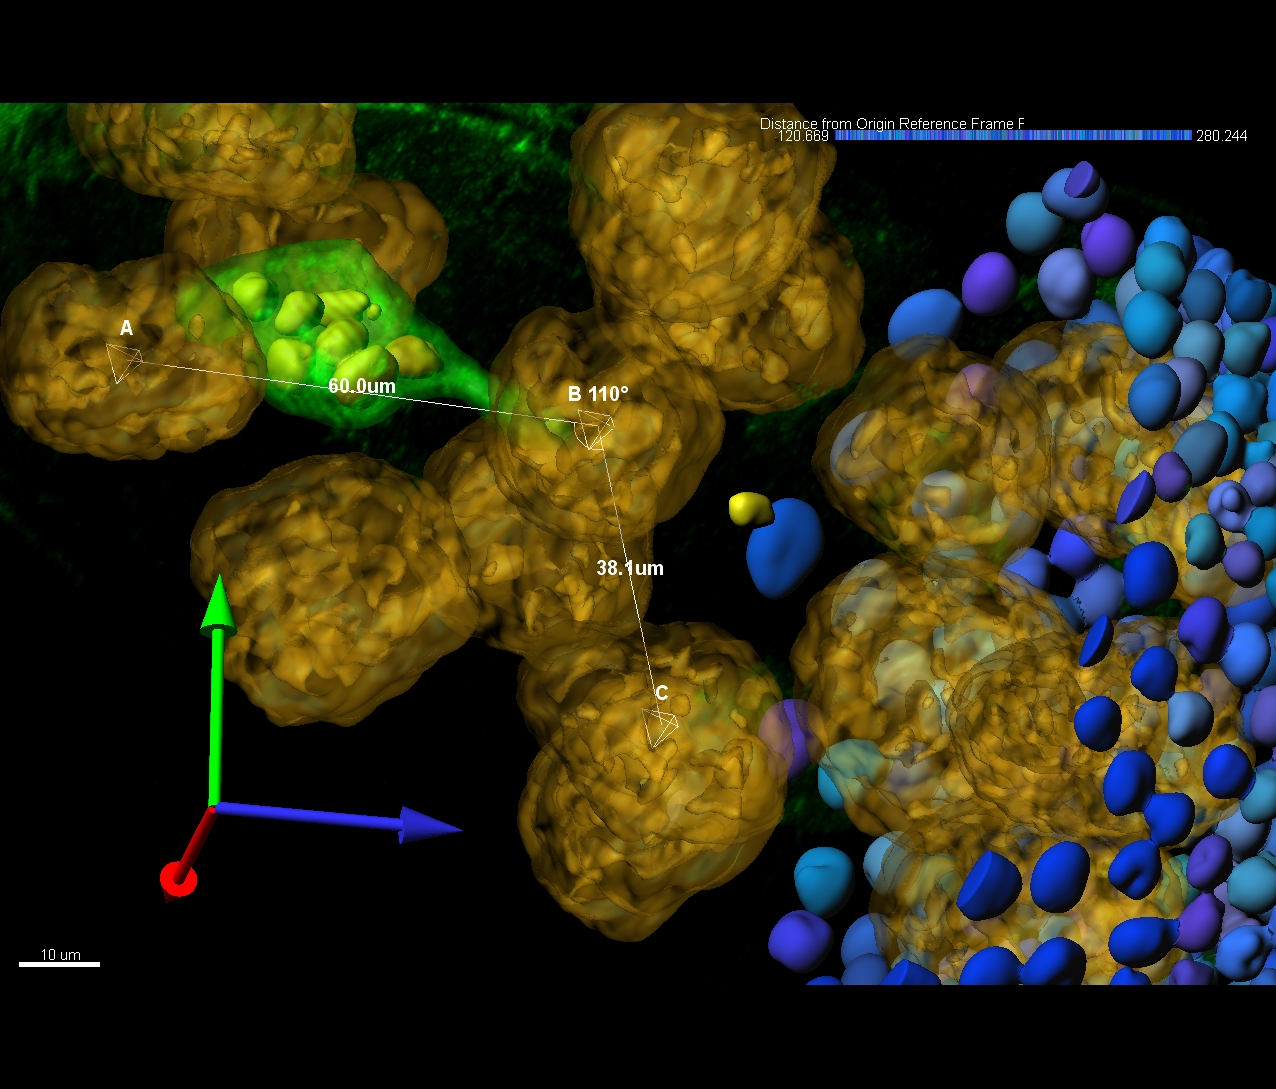
  • XYZ coordinates of each objects are calculated, relative distances to other objects can be measured
  • Can be tracked in time (5 high performance motion algorithms)

オルガネラを持つ細胞

Use Imaris Cell for smart detection of cells based on cytoplasm or plasma membrane labelling. Cytoplasm, nucleus, nucleoli and various populations of vesicles can be detected and analyzed within a complete cell object.

 
  • Segments multiple biological components simultaneously (e.g. cells based on membrane or cytoplasm labels, nuclei, lysosomes, vesicles)
  • Performs image analysis on a per cell basis (e.g. number of vesicles per cell, distance of each vesicle from cell boundary)
  • Measures relative distance from vesicles or other organelles to cell membrane or nuclei border

膜のラベリング

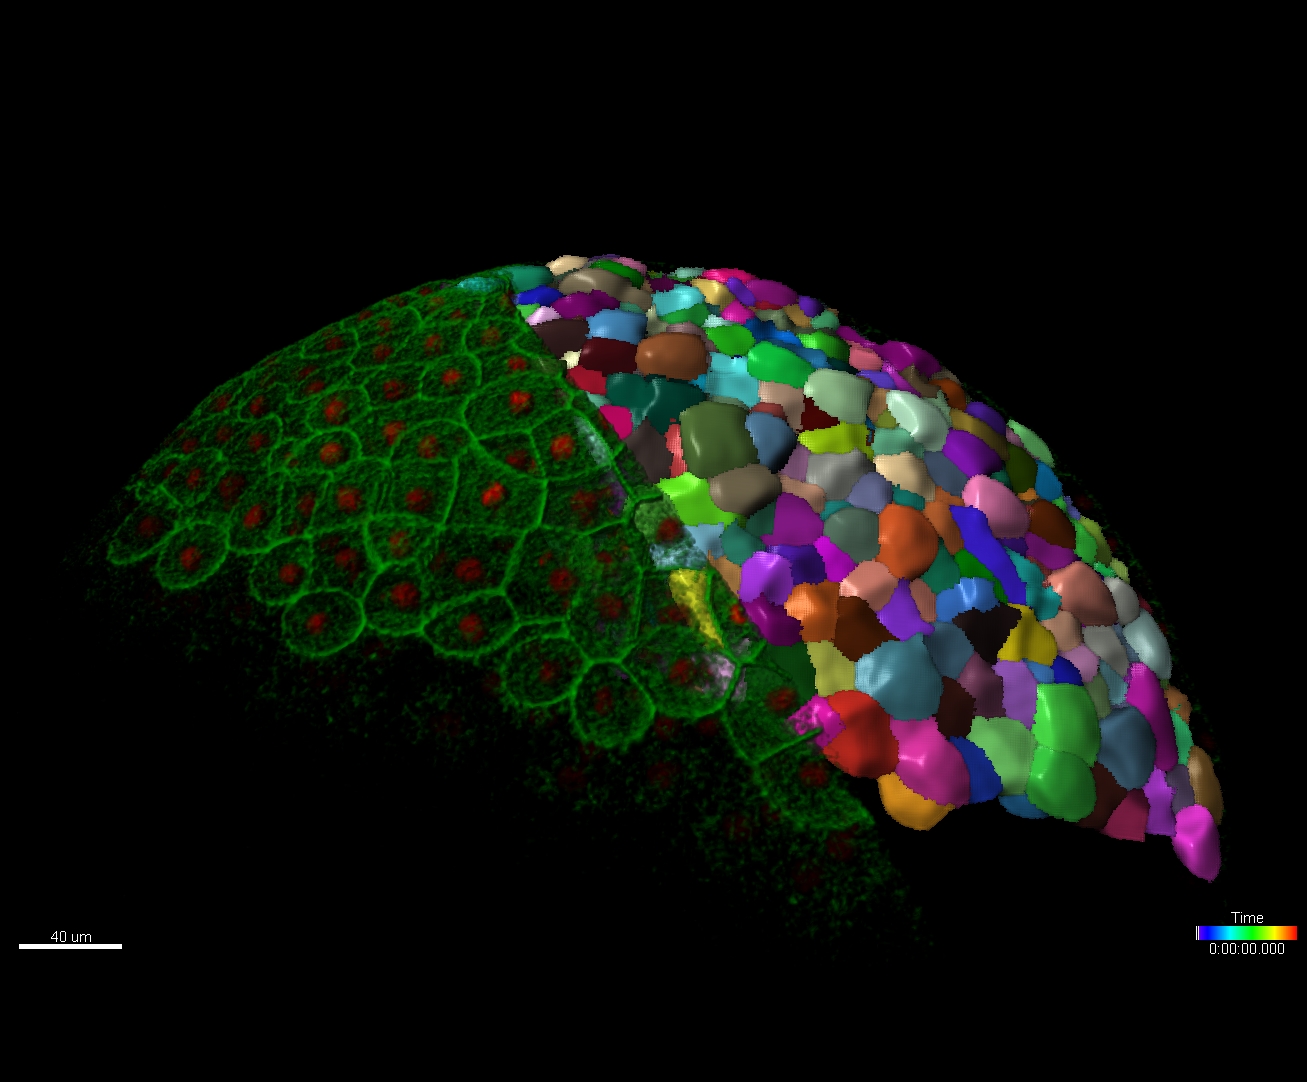
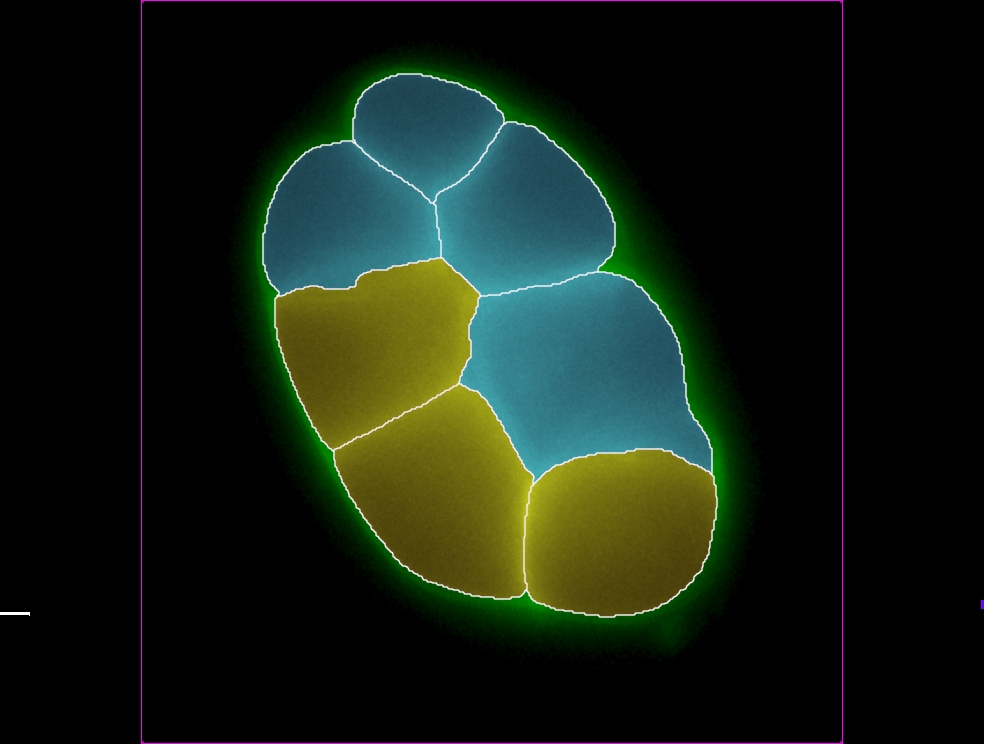
Use Imaris Cell for detection of objects where the fluorescent signal is located only on their surface (i.e with membrane or cell wall labelling only). Model the exact shape and report measurements such as volume or surface area for closely touching cells.

 
  • Precisely segments touching or sparse objects like cells with plasma membrane, nuclear envelope or cell wall staining only
  • Inspects the quality of segmentation in all directions using 2D slicers
  • Counts objects within the specified region of interest (whole dataset or subset)
  • Reports morphological measurements such as volume, bounding box length and sphericity

実生活でのモーショントラッキング

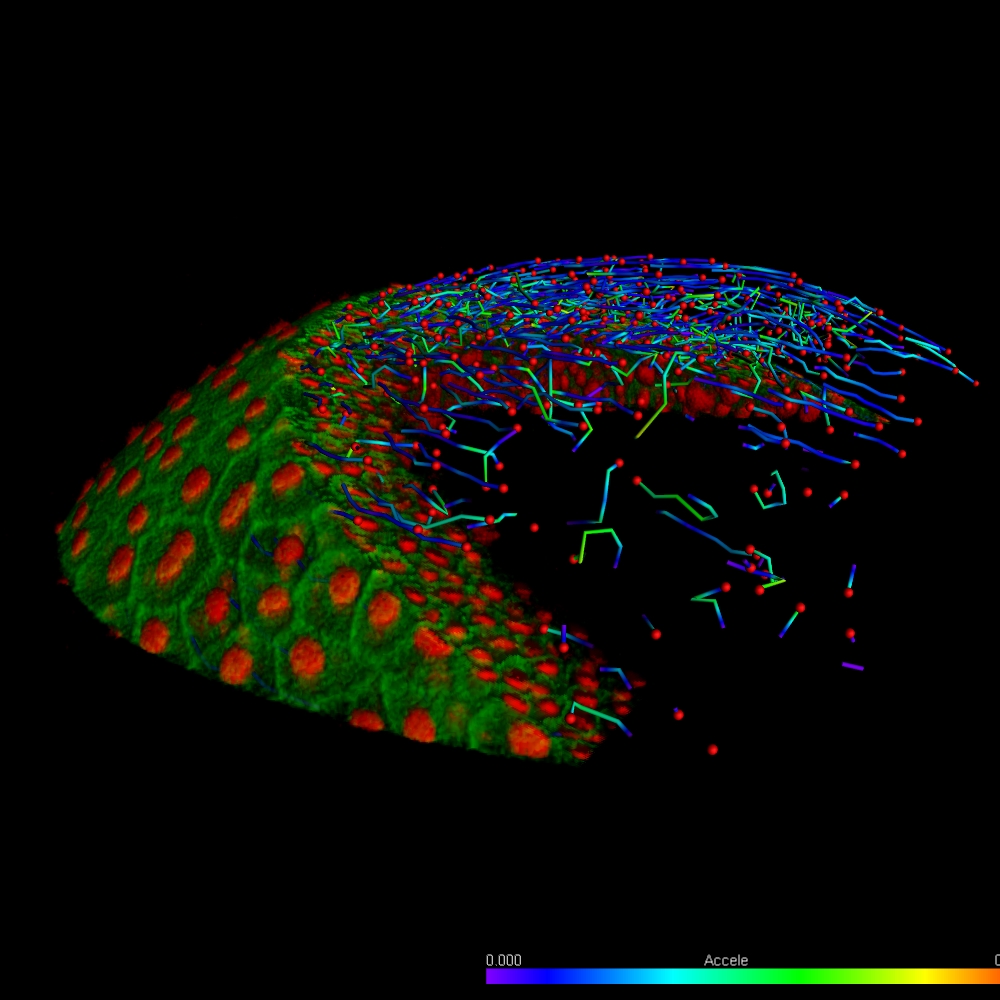
Imaris for Cell Biologists is the most powerful commercial software for live cell tracking & analysis. It rises to the challenge of monitoring temporal changes in biological systems. Users have a choice of multiple sophisticated automatic tracking algorithms, manual tracking options as well as an intuitive and interactive track editing tool.

3Dや2Dでのモーショントラッキング

 
  • Automatically track objects of interest using one of the provided algorithms
  • Handle thousands of objects and time points
  • Represent trajectory or displacement using multiple visualization options
  • Calculate average and instantaneous speed, acceleration
  • Manually create and edit tracks

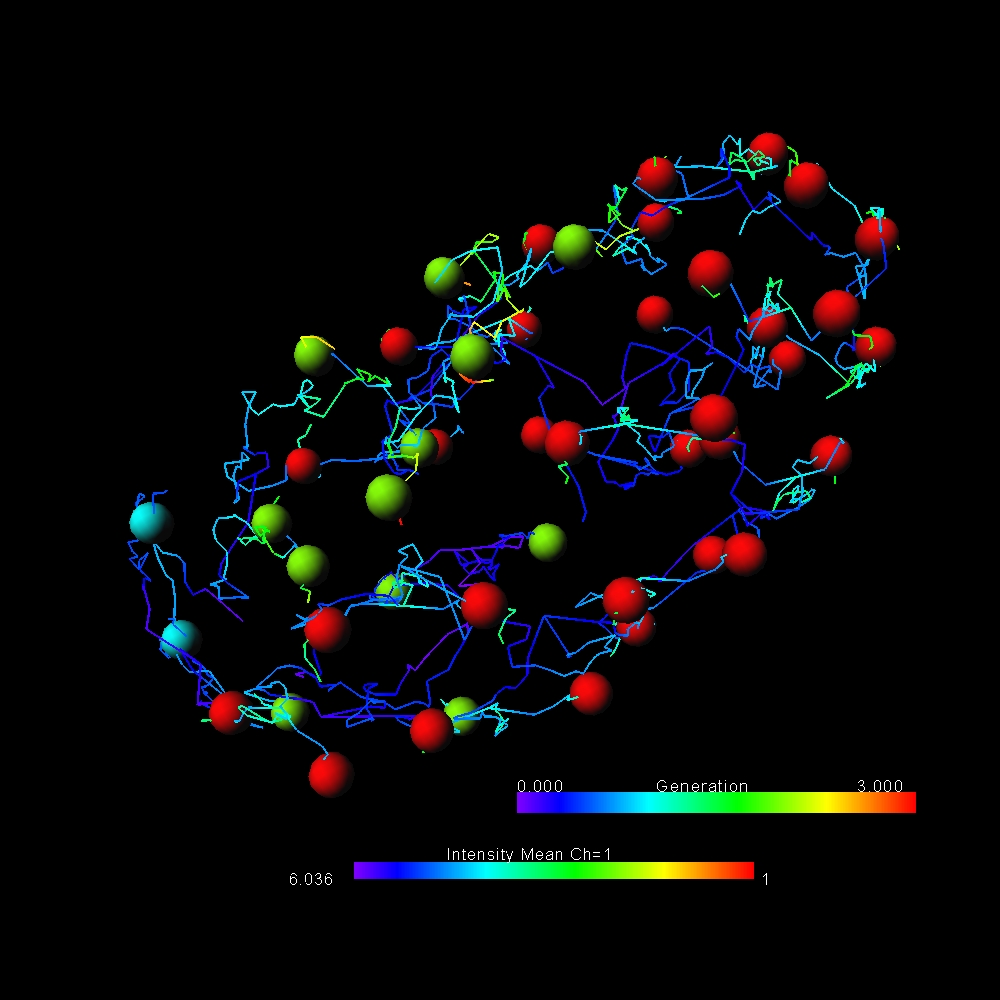
細胞の分裂と系譜の追跡(核のラベリング)

 
  • Use the provided lineage algorithm designed for tracking dividing cells and nuclei
  • Explore cell fate from one progenitor cell to the final generation
  • Automatically create an editable lineage tree
  • Mark selected lineage tree branches with colored labels and analyse your data per lineage
  • Calculate Cell Cycle Duration, Generation, Time Since First Division, Time Since Previous Division

細胞の分裂と系譜の追跡(膜ラベリング)

 
  • Use the provided Maximum Overlap algorithm designed for tracking dividing cells with membrane labelling that touch one another.
  • Explore cell fate from one progenitor cell to the final generation
  • Automatically create editable lineage tree
  • Mark selected lineage tree branches with colored labels and analyse your data per lineage
  • Calculate Cell Cycle Duration, Generation, Time Since First Division, Time Since Previous Division

統計と測定

After segmenting the image data Imaris calculates a wide range of statistics for all detected objects: Cells, Surfaces and Spots. All values can be used for color coding, plotted inside Imaris (using Vantage plots) or exported in an .csv or .xls file format. Parameters presented below are the most common statistic types needed by biologists. Imaris reports many more.

Motion Analysis
  • Average Speed
  • Instantaneous Speed
  • Acceleration
  • Track length
  • Cell cycle duration
Cells
  • Volume
  • Vesicles per Cell
  • Distance to Membrane
  • Vesicles per Nucleus
  • Distance to Cell Center
Spots
  • Number (count)
  • Position (x, y, z)
  • Distance between Spots
  • Distance to Surface object
  • Speed
Surfaces
  • Area
  • Volume
  • Intensity
  • Elipcity
  • Sphericity

プロット、統計的検定、グループ比較

Imaris for Cell Biologists includes a seamlessly integrated tool to explore differences between experimental groups (e.g. control vs test) - ImarisVantage. It allows for the creation of interactive plots which help illustrate relationships/patterns/differences amongst object measurement or groups of objects and reveal hidden relationships.

散布図

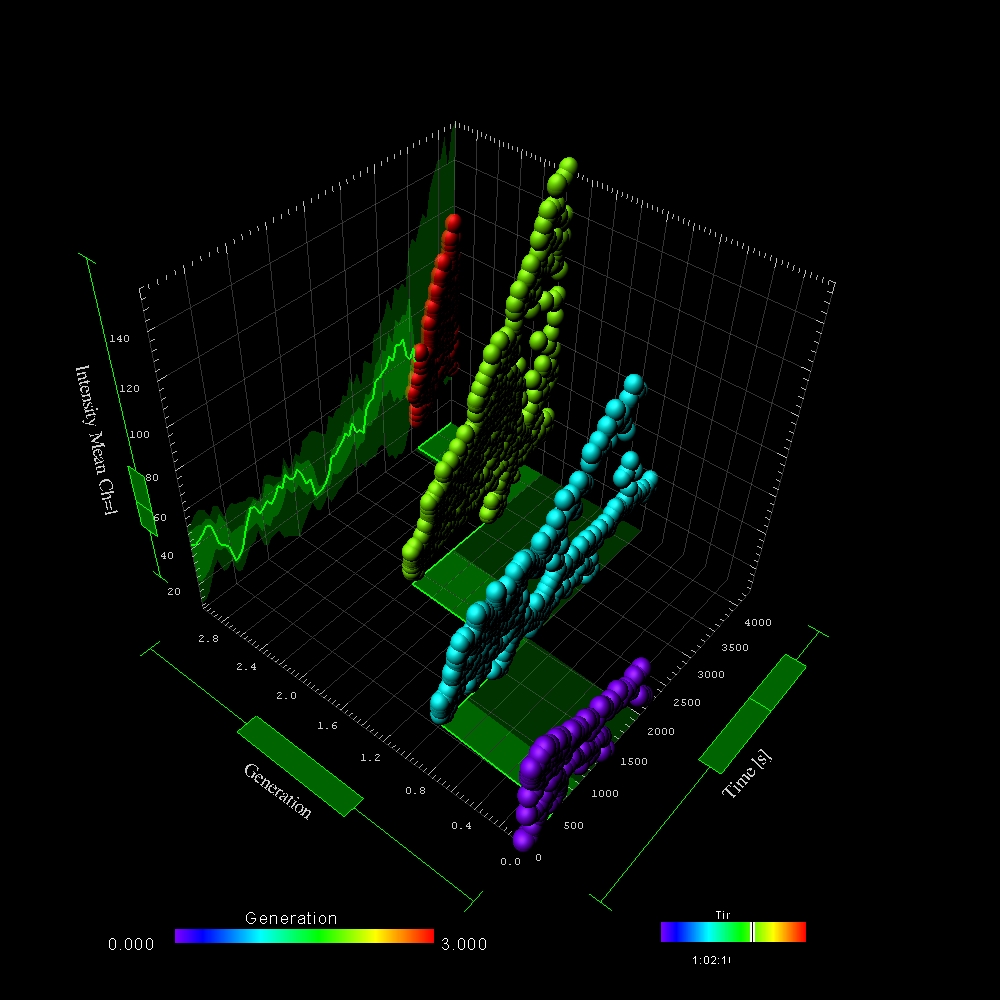
  • Explore hidden relationships within your data by plotting them on the 2D/3D interactive Vantage plot
  • Select up to five measurements which will be represented within x, y, z axes, size and color
  • Select objects of interest within the Vantage plot and explore them in the 3D space
 

グループ比較 (3D)

  • Apply an image analysis protocol to multiple datasets of the same type (i.e. control and test groups)
  • Upload objects from multiple datasets to the same Vantage plot
  • Compare measurements amongst groups by selecting different measurements for the axes
 

統計的検定

  • Create single-dimension univariate scatterplots for a selected measurement from one or more images or group of images
  • Report the results of pairwise: T-test, F-test, Kolmogorov-Smirnov and Wilcoxon
  • Export your plots in a ready to use format for papers and presentations
 

ビジュアル化とアニメーションのエクスポート

Imaris provides a complete set of features for visualization of multi-channel microscopy datasets from static 2D images to 3D time series regardless of their size and format. Using Imaris for Cell Biologists users can:

細胞生物学者にとってのイマリスの更なるメリット

Imaris for Cell Biologist Package provides many more advantages and flexibility to experience complete analysis freedom during your experiments.

画像データ管理t

Arena – Organize Your Image Data into Logical Groups

  • Organize and manage all image data related resources (e.g. raw data, segmented results, image analysis protocols)
  • Organize your images into Assays and Groups to represent your experiment structure
  • Search all (or part) of your image related resources
  • Tag resources for easy searches and organizati
 

Co-ローカリゼーション

ImarisColoc is the most powerful co-localization analysis tool to quantify and document co-distribution of multiple stained biological components.

  • Co-localization available for 2D, 3D data and time series
  • Co-localized regions can be presented as new 3D or 4D color channel
  • Users can expand or narrow the region from which histograms for co-localization are computed
  • Automatic calculation of: Pearson’s coefficient, Mander’s coefficient, co-localized voxels, co-localized percentages
 

カスタマイズ可能な2ウェイインターフェース

The Imaris XT module is particularly useful for scientists who write their image analysis code in Matlab or Python and for everyone who has sophisticated image analysis needs which are not fully covered by the main functionality of Imaris. Imaris XT provides:

  • Access to the pre-existing library of XTensions – custom image analysis scripts which can be modified for specific applications
  • Two-way interface from Imaris to classic programming languages: Matlab, Java or Python and an image export/import to Fiji
  • The ability to integrate custom algorithms which exceed the possibilities of generic image processing.

追加リソース

The Imaris Learning Center hosts a wide range of tutorial videos, how-to articles and webinars to guide you through the many features of Imaris. We have provided some links below which will get you started on some of our most recent developments.