- Average Speed
- Instantaneous Speed
- Acceleration
- Track length
- Cell cycle duration
Imaris Open
FILE EXCHANGE & FORUM
Frequently Asked Questions
The Imaris for Cell Biologists package is ideal for researchers in several life science disciplines who require a broad range of functionalities to study cells and organisms. In addition to Imaris’ proven 3D/4D visualization and analysis tools, Imaris for Cell Biologists provides the functionality for smart cell based segmentation, analysis on a per cell basis and discovery of intracellular relationships. The package includes automated tracking, detection of cell division and creation of interactive lineage trees along with statistical tests and a two-way interface for customization in Matlab, Java or Python.
Request PricingImaris for Cell Biologists provides multiple options to detect and model your biologically relevant structures via step-by-step wizards with a preview of the results at each point in the workflow.
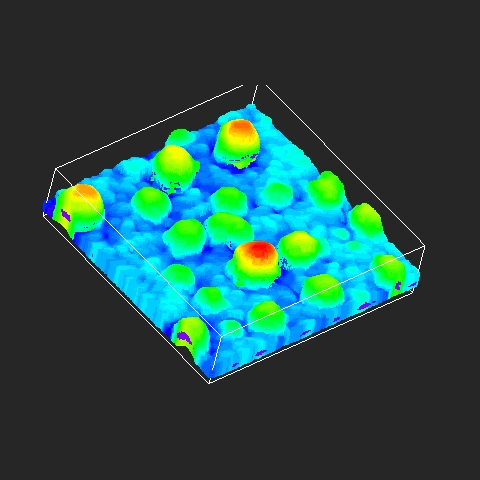
Use Imaris Surfaces to precisely visualize and measure organelles, nuclei, biofilms, cells, tissues, organs, embryos as well as organoids:
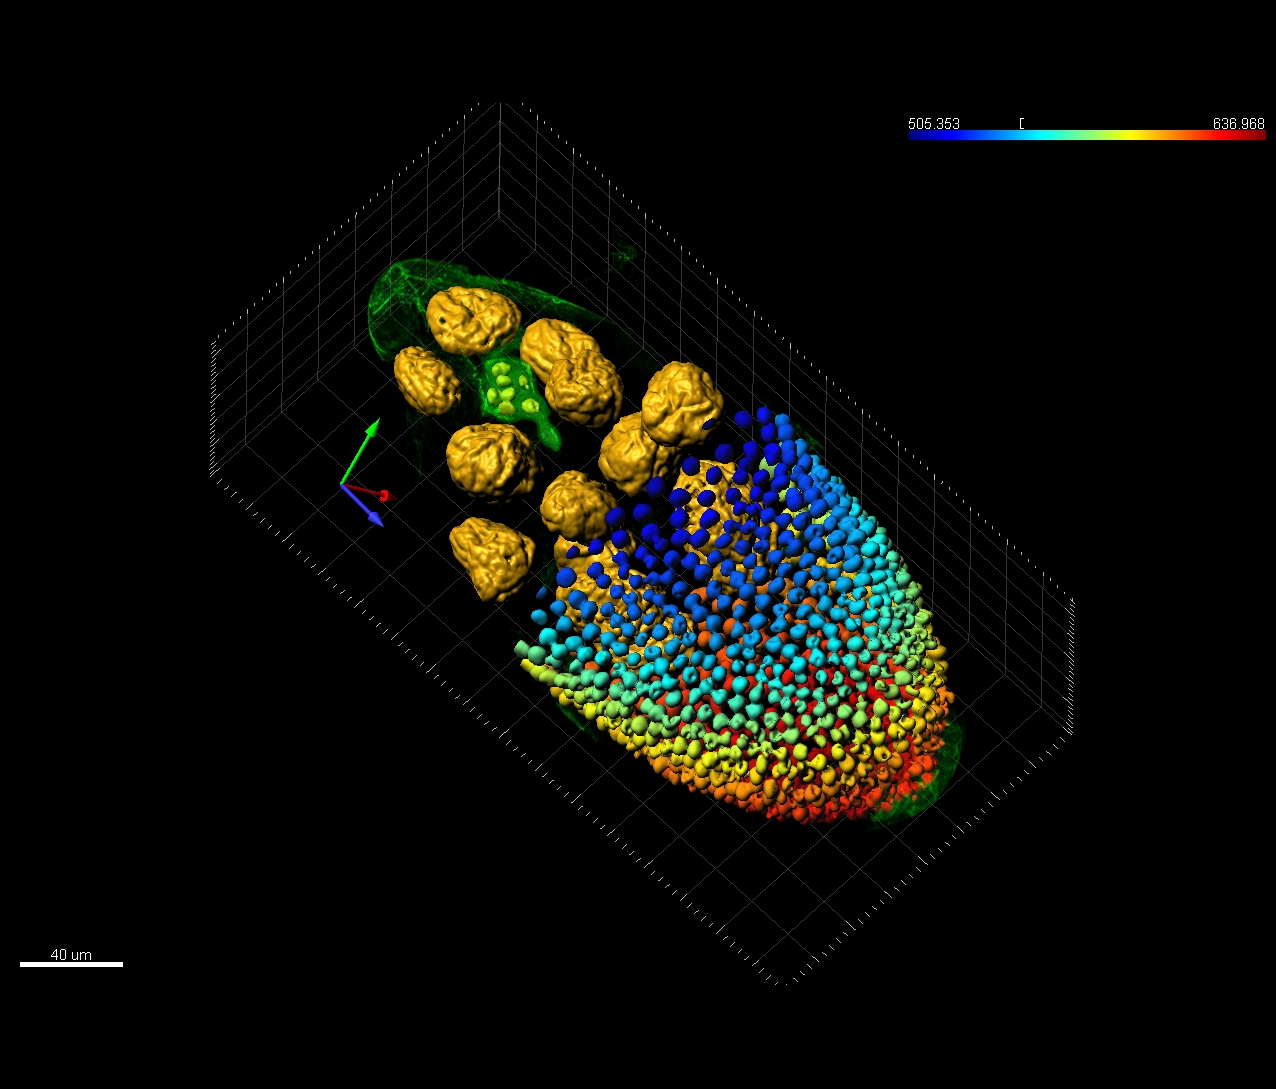
Use Imaris Spots to detect: particles, protein clusters, vesicles, nucleoli, nuclei, centrosomes, cells and bacteria.
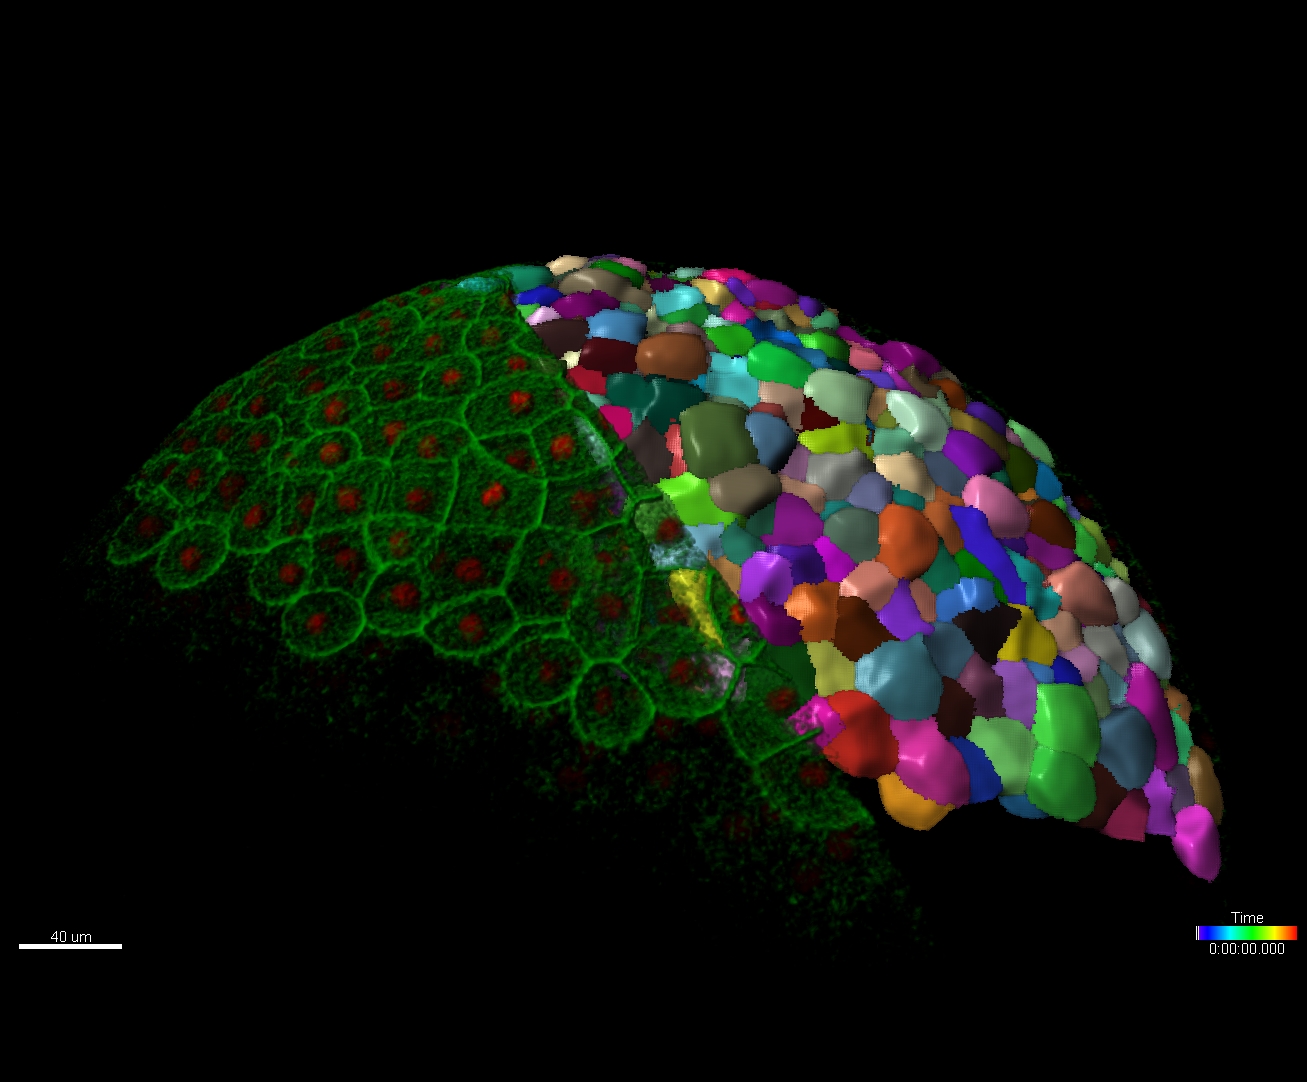
Use Imaris Cell for smart detection of cells based on cytoplasm or plasma membrane labelling. Cytoplasm, nucleus, nucleoli and various populations of vesicles can be detected and analyzed within a complete cell object.
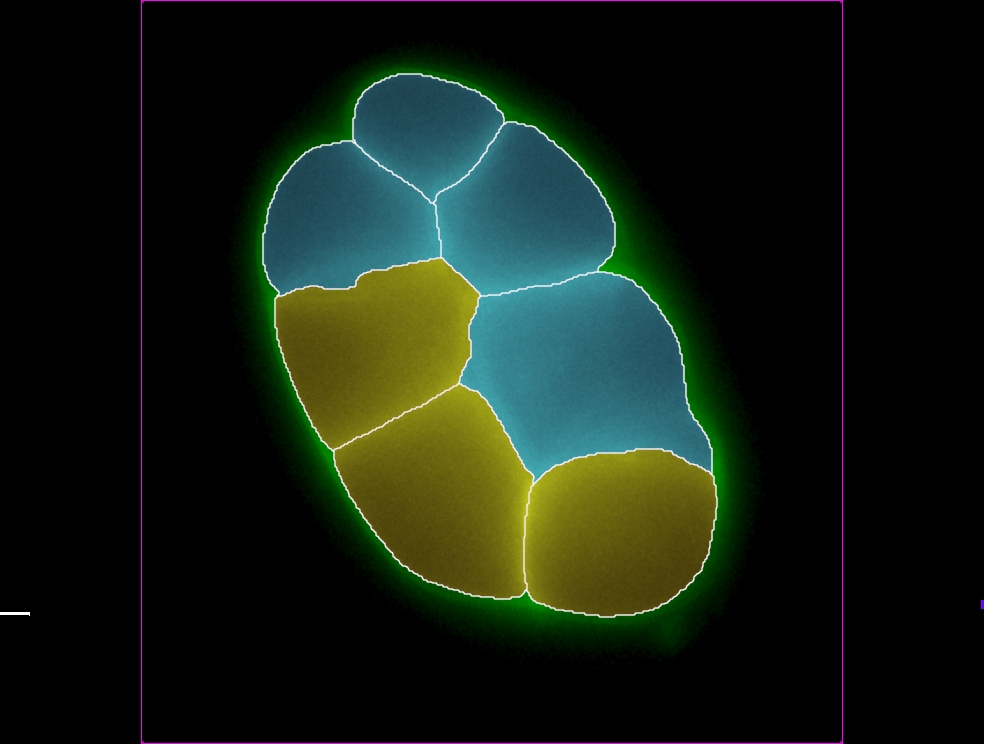
Use Imaris Cell for detection of objects where the fluorescent signal is located only on their surface (i.e with membrane or cell wall labelling only). Model the exact shape and report measurements such as volume or surface area for closely touching cells.
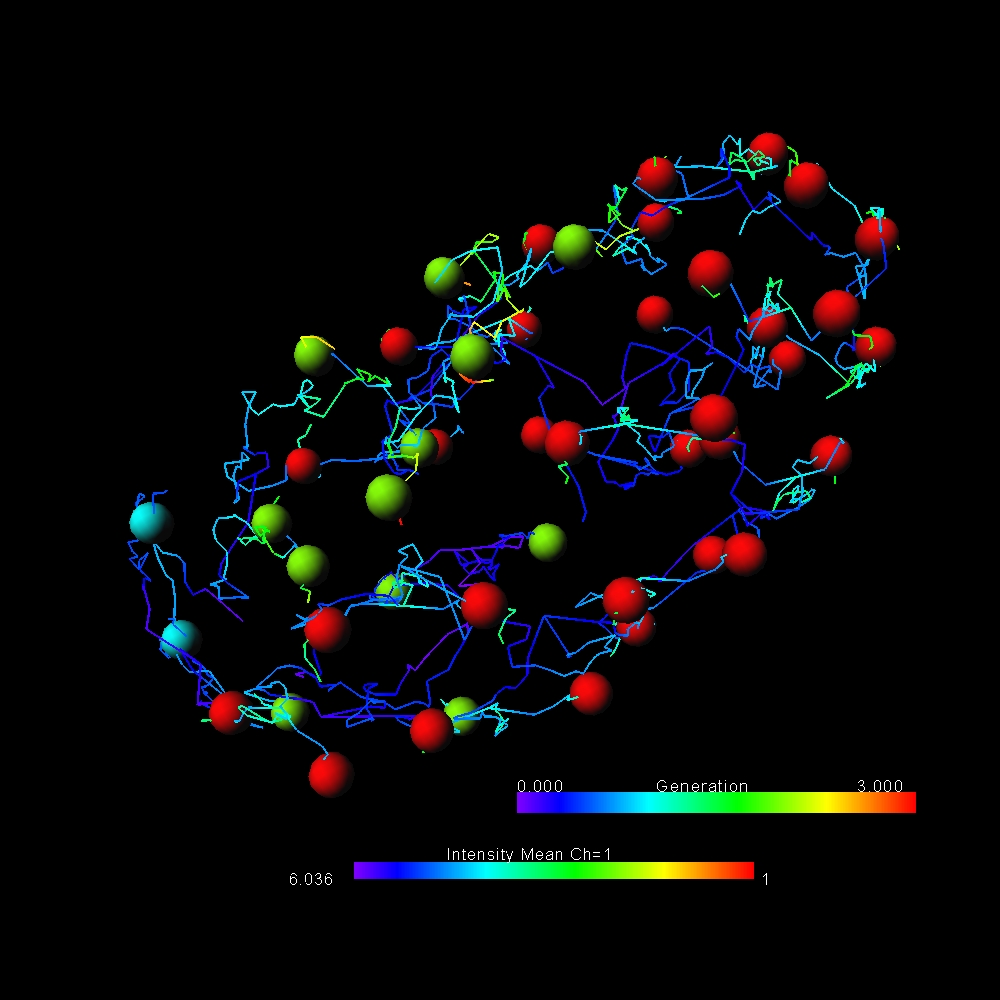
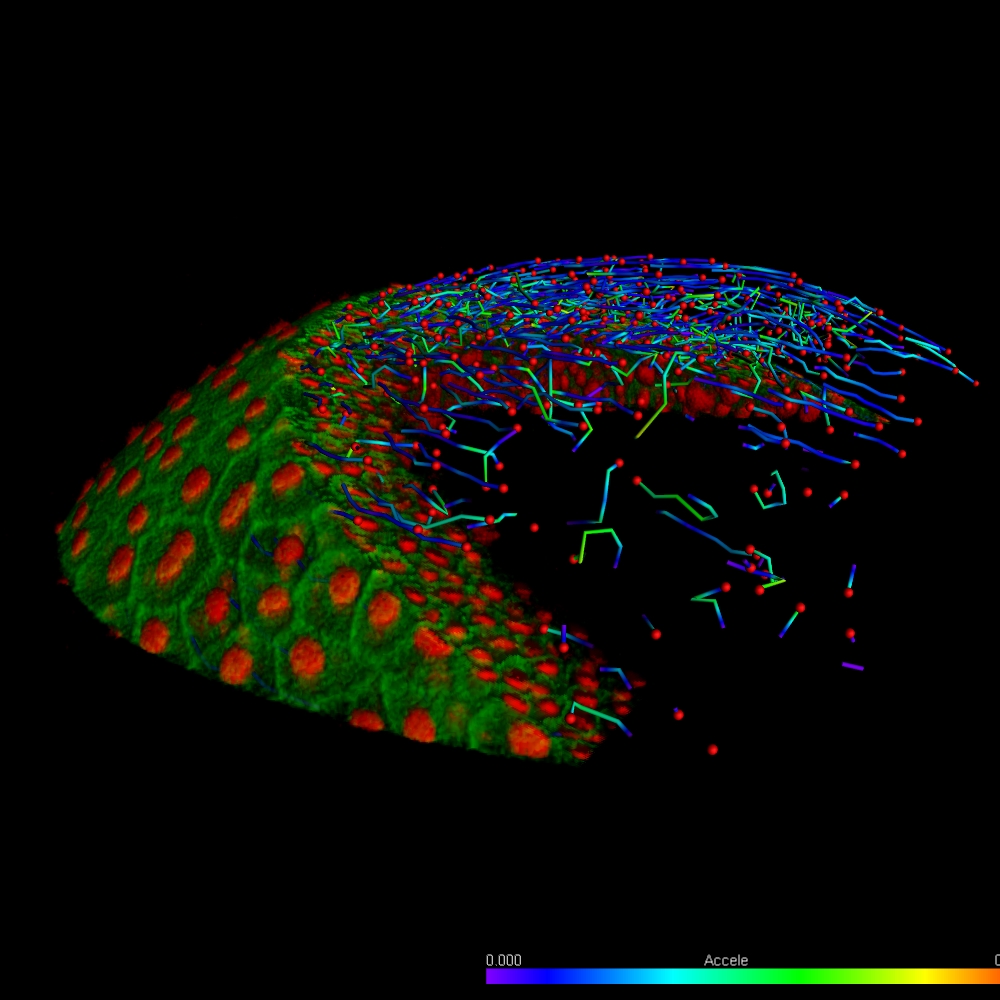
Imaris for Cell Biologists is the most powerful commercial software for live cell tracking & analysis. It rises to the challenge of monitoring temporal changes in biological systems. Users have a choice of multiple sophisticated automatic tracking algorithms, manual tracking options as well as an intuitive and interactive track editing tool.
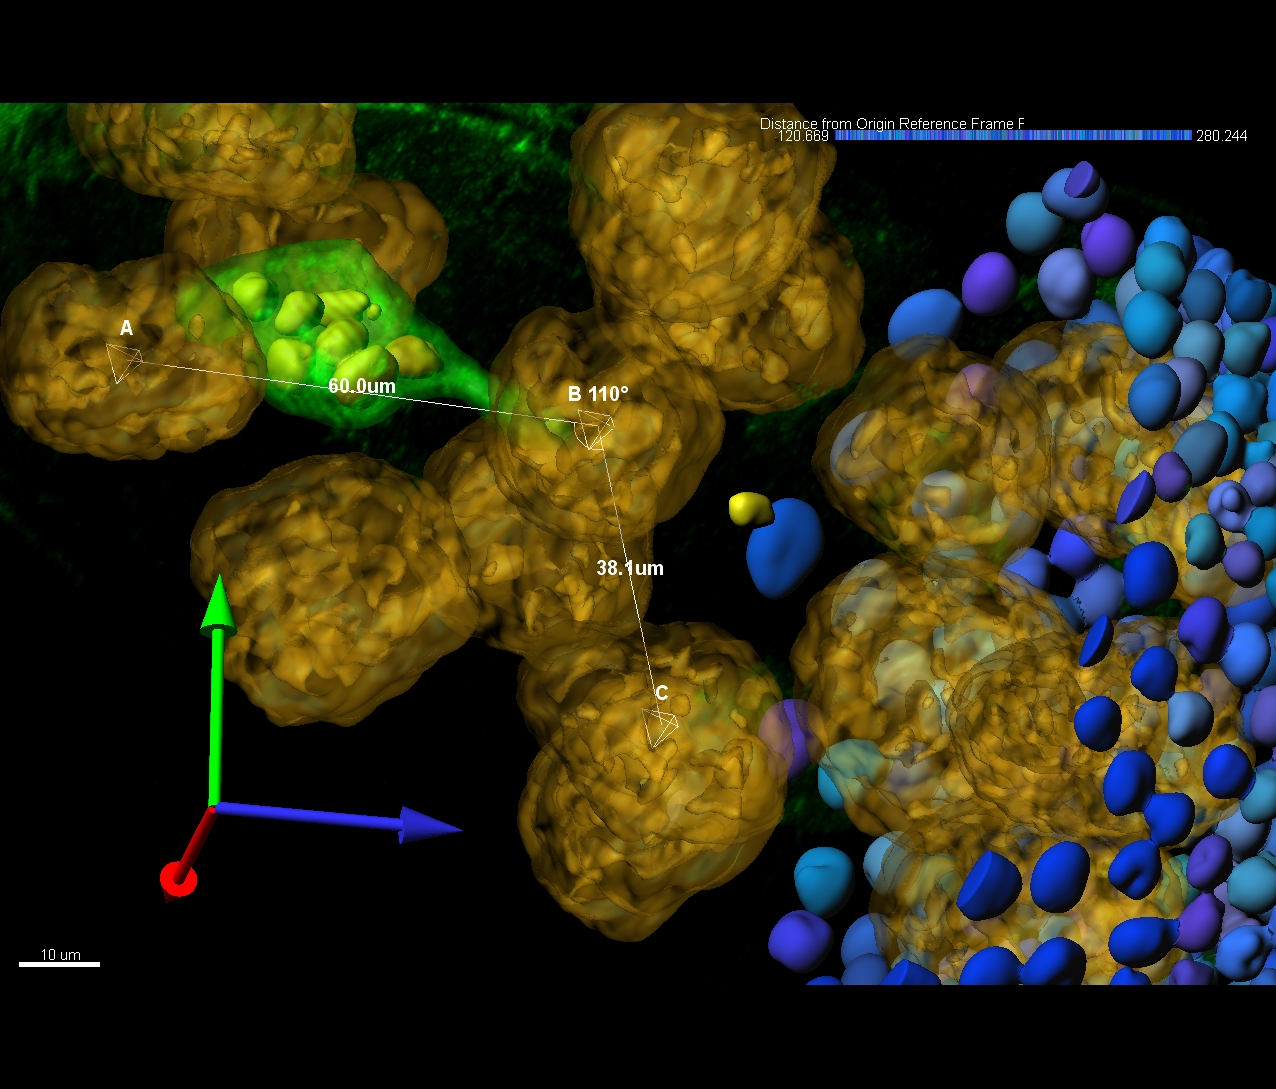
After segmenting the image data Imaris calculates a wide range of statistics for all detected objects: Cells, Surfaces and Spots. All values can be used for color coding, plotted inside Imaris (using Vantage plots) or exported in an .csv or .xls file format. Parameters presented below are the most common statistic types needed by biologists. Imaris reports many more.
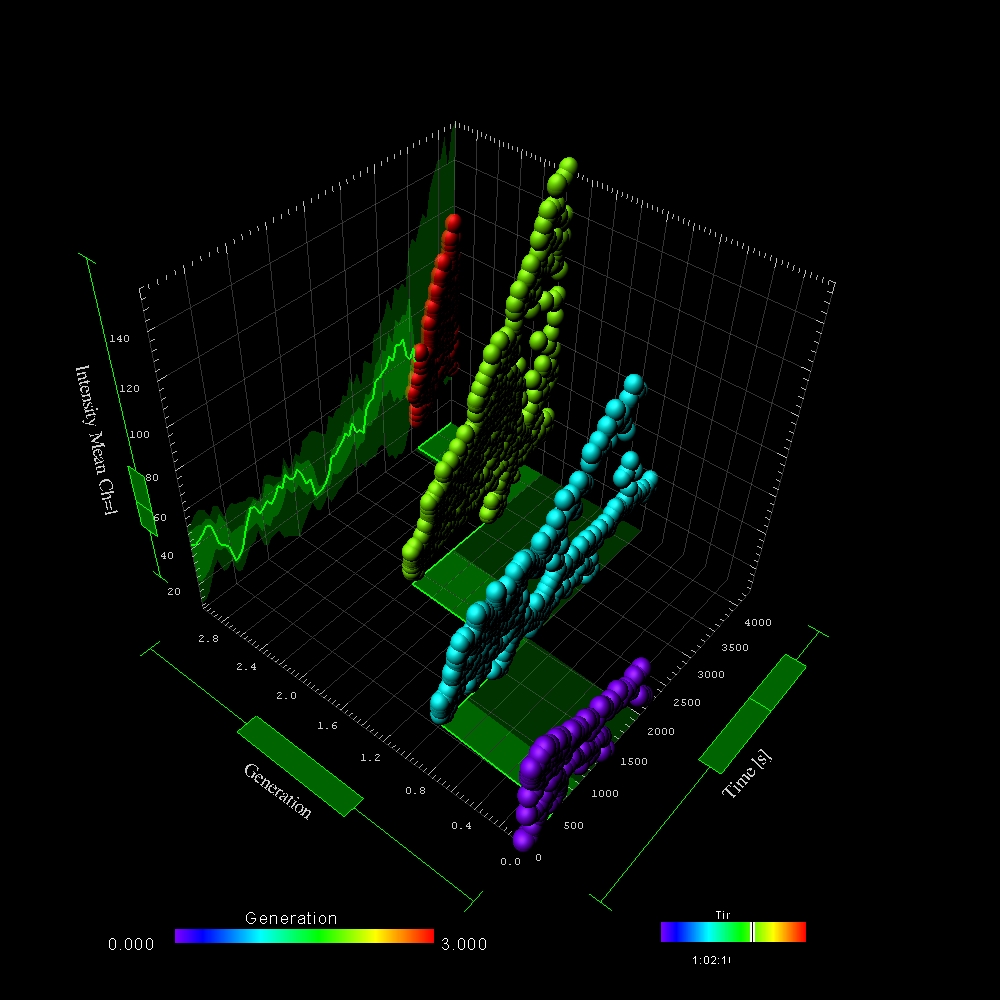
Imaris for Cell Biologists includes a seamlessly integrated tool to explore differences between experimental groups (e.g. control vs test) - ImarisVantage. It allows for the creation of interactive plots which help illustrate relationships/patterns/differences amongst object measurement or groups of objects and reveal hidden relationships.
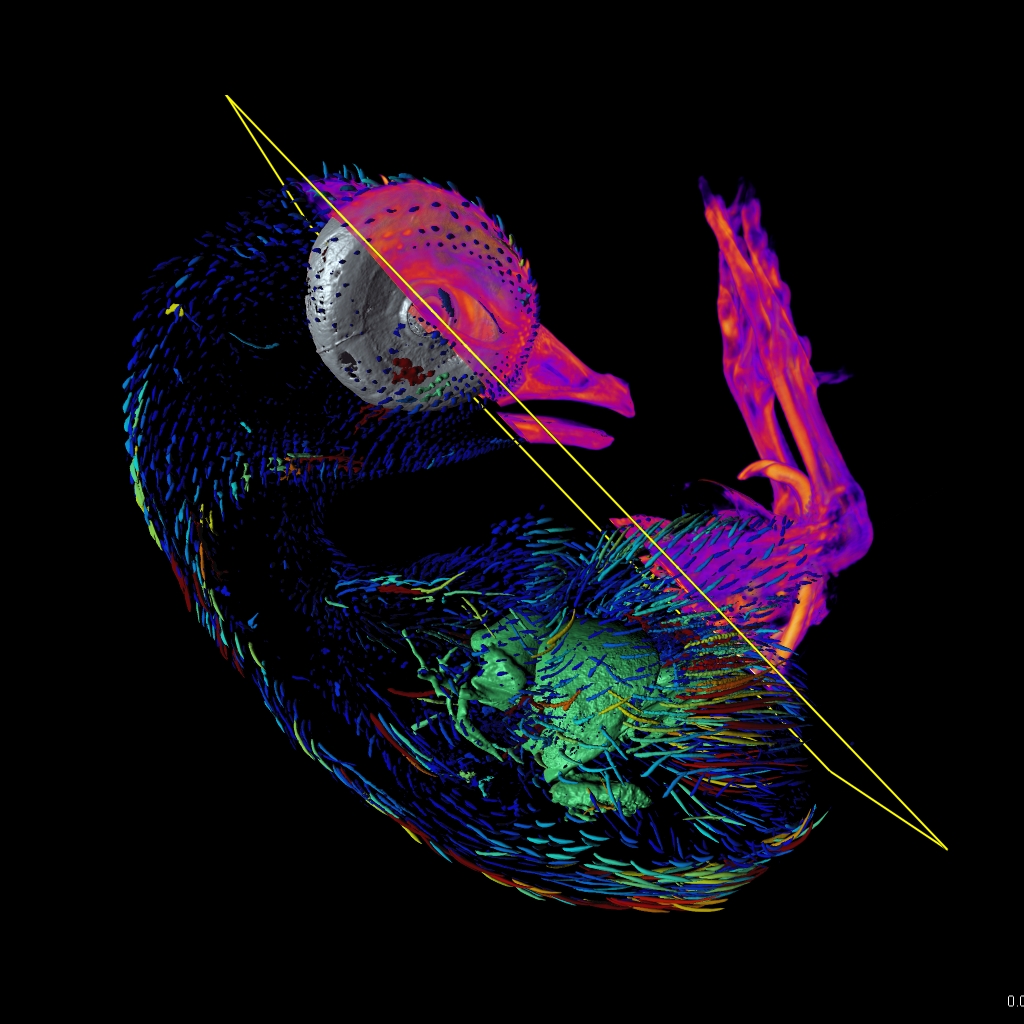
Imaris provides a complete set of features for visualization of multi-channel microscopy datasets from static 2D images to 3D time series regardless of their size and format. Using Imaris for Cell Biologists users can:
Imaris for Cell Biologist Package provides many more advantages and flexibility to experience complete analysis freedom during your experiments.
Arena – Organize Your Image Data into Logical Groups
ImarisColoc is the most powerful co-localization analysis tool to quantify and document co-distribution of multiple stained biological components.
The Imaris XT module is particularly useful for scientists who write their image analysis code in Matlab or Python and for everyone who has sophisticated image analysis needs which are not fully covered by the main functionality of Imaris. Imaris XT provides:

The Imaris Learning Center hosts a wide range of tutorial videos, how-to articles and webinars to guide you through the many features of Imaris. We have provided some links below which will get you started on some of our most recent developments.

© オックスフォード・インストゥルメンツ 2026

 Powered by Bioz